Xing Shen^a, Xiaowei Wang^a, Qi Ye^b, Aijun Ye^{a,*}
^a State Key Laboratory for Disaster Reduction in Civil Engineering, Tongji University, Shanghai 200092, China
^b Chi Consulting Engineers, Summit, NJ 07901, USA
Corresponding author: Aijun Ye (yeaijun@tongji.edu.cn)
ARTICLE INFO
Keywords:
Transverse Steel Damper (TSD)
Seismic performance
Long span bridge
Seismic system
Fixed system
Sliding system
Transverse direction
ABSTRACT
To provide seismic resistance of long span bridges in transverse direction, fixed bearings are often installed between girders and piers (or towers). Although the fixed bearings and substructures can be designed extraordinarily strong to resist the design seismic loads, they may still be vulnerable when the design seismic loads are exceeded. To address this issue, this paper proposes a novel seismic system, which combines Transverse Steel Dampers (TSDs) with conventional sliding bearings, and is named the TSD seismic system. A TSD consists of several triangular steel plates outfitted with steel hemispheres at their upper vertices. The steel hemispheres not only allow free movements of the superstructures with respect to the piers in the longitudinal direction, but also provide reliable load paths in the transverse direction. Quasi-static tests have been conducted to investigate seismic behaviors of the TSD using two scaled and two prototype specimens. Test results show that the TSD has excellent performance in energy dissipation, large displacements, and synchronization of triangular plates under complex contact conditions. The load-displacement constitutive model of the TSD has been established using a bilinear model in ABAQUS, followed by a design method for the TSD seismic system. A 620\text{m} long-span cable-stayed bridge was selected for a case study of the TSD seismic system. Ground motions recorded at various site conditions were used as seismic inputs. Numerical results show that: (1) the TSD seismic system can achieve a desired balance of transverse seismic displacements and forces, which is not the case when a sliding bearing system (without TSDs) or a fixed bearing system is used; (2) TSDs contribute to most of the energy dissipation capacity of a TSD seismic system while the contribution of sliding bearings is negligible; and (3) the proposed TSD seismic system, compared with a sliding system, tends to be less sensitive to seismic input properties, such as peak ground accelerations and site conditions.
1. Introduction
Sliding and fixed bearing systems have been commonly used in the transverse direction of long span bridges to resist lateral seismic excitation. In areas of low seismic intensities, the sliding system is a common choice. Specifically, anchor bolts that constrain the movement of bearings in transverse direction under service loads are designed to fail when seismic forces exceed their design capacities. However, in areas of high seismic intensities, the sliding system is not appropriate because displacements between girders and piers may exceed their design levels, resulting in higher possibility of unseating. Therefore, the fixed system is used most often to constrain the transverse movements. Three issues should be considered when a fixed bearing system is used. Firstly, large transverse forces would develop in piers and foundations, which inevitably lead to over-sized structural members and high costs. Secondly, large transverse forces could also develop in the bearings, which increase design requirements and costs for the bearings. Thirdly, bearings, piers and foundations could still be damaged when the magnitudes of actual earthquakes exceed design values1,2. In order to achieve more balanced transverse forces and displacements between the girders and piers in long span bridges, different types of seismic devices are needed. A discussion of previous representative work on seismic devices follows.
Friction Pendulum Sliding Bearings (FPSBs), Viscous Fluid Dampers (VFDs) and Metallic Yielding Dampers (MYDs) have been commonly used on bridges to mitigate seismic demands. The energy dissipation capacities of FPSBs mainly depend on the magnitude of vertical dead loads3. Therefore, they are not suitable for the cases that the vertical dead loads are relatively small. In long span bridges, VFDs are commonly used as seismic devices in the longitudinal direction and have been studied extensively in recent decades. The Rion-Antirion cable-stayed bridge in Greece4 used VFDs in the transverse direction. However, complex structural details are required to decouple the VFDs from longitudinal movements of the bridge, thus making it difficult to be widely applied for transverse seismic protection. Since Yao5 firstly proposed the concept of structural vibration control, a series of energy dissipation mechanical devices and dampers, collectively known as the structural protecting system, have been developed. MYDs, proposed by Kelly6 were initially introduced as passive control devices in structural engineering. Currently, MYDs are most commonly used in buildings, even though there have been some application in bridges with relatively short spans. MYDs can be categorized into four types based on different mechanisms: torsion, bending, axial tension and compression, and shear. Torsional beam devices7,8 were used for providing base isolation on Rangitikei Rail Bridge in New Zealand (a 56\text{m} simple-supported girder bridge). Steel cantilever beam devices9 were used on Cromwell Bridge in New Zealand (a 60\text{m} steel truss bridge). Tapered cantilever dampers10,11 were installed on Dunedin Motorway Overbridge in New Zealand (a 52\text{m} simply-supported girder bridge). Shaft elements and frame-type devices12 were used on Mortaiolo Bridge in Italy (a continuous concrete girder bridge). C-type devices13 were installed on Bolu Viaduct in Turkey. In summary, most of the MYDs were applied in the longitudinal direction of bridges with relatively short spans. When the MYDs are used in the transverse direction of long span bridges, there are many issues need to be addressed, which include: ultimate strengths; displacement capacities; space constraints; accommodations to longitudinal movements of girders; deformation accommodations due to temperature variations of concrete; shrinkage and creep. Because of these challenges, novel seismic devices to mitigate transverse seismic demands for long span bridges are in great demand.
A Transverse Steel Damper (TSD) seismic device is presented in this paper. Theoretical and experimental studies were conducted for the TSD. A design method for the proposed transverse seismic system (called TSD seismic system) consisting of the TSD and conventional sliding bearings is proposed. A real 620\text{m} long span cable-stayed bridge was selected for a case study to validate the feasibility of the design method and the effectiveness of the TSD seismic system. Seismic performance of the TSD seismic system was analyzed and compared with conventional sliding or fixed systems.
2. Transverse Steel Damper (TSD)
2.1. Problem descriptions
One of the key issues of seismic devices is the choice of appropriate components for energy dissipations. Past studies14,15,16,17 have verified that triangular-shaped and X-shaped plates possess excellent energy dissipation capacities, because the sections along the heights of such plates can develop full plasticity simultaneously. Dampers with these types of plates have been used extensively in buildings for seismic mitigation and retrofits. However, considering the differences in load paths and spatial constraints between buildings and bridges, these types of dampers, though proven to be effective for buildings, could not be directly used on bridges. Firstly, the inertial forces are almost linearly distributed along the height of a regular building. Base shear forces and story drifts are most influential parameters in the seismic design of buildings. While for bridges, inertial forces are primarily generated by superstructures and then transferred to substructures through bearings. The seismic forces in bearings, piers and foundations, and the relative deformations between girders and piers are key parameters in the seismic design of bridges. Secondly, dampers are placed between floors in buildings, whereas on bridges, they are installed in the much narrower spaces between girders and piers. Thirdly, dampers in buildings do not experience appreciable deformations in operating conditions, while in bridges, transverse dampers need to accommodate longitudinal displacements of the girders under normal operational conditions, resulting in complex configuration of the dampers.
Considering the issues of existing seismic devices, the proposed TSD should have the following features: (1) adaptability to longitudinal displacements of the bridge without affecting the transverse energy dissipation capabilities; (2) fit within limited spaces between girders and piers; (3) reliable load paths during earthquakes; and (4) mathematical constitutive models that can be easily verified using finite element method. Also, since nonuniform seismic demands may cause bridges to rotate in plane and lead to torsional failures of the X-shaped dampers18, the proposed TSD uses triangular plates to reduce the probability of torsional failures.
2.2. TSD configurations
The configuration of the TSD is illustrated in Fig. 1. It consists of two parts. The upper part is bolted to the underside of girders. The steel blocks of the upper component are designed sufficiently stiff to transfer inertial forces to the triangular plates of the lower part. Design provisions on the height of the steel block (H_s in Fig. 1(d)) are discussed in Section 2.3.1. Polytetrafluoroethylene (PTFE) slides are attached to steel block surfaces to facilitate the sliding of hemispheres. The lower part is bolted to the top of piers or cap beams. The triangular plates are welded to the base plates. The hemispheres are installed at the vertices of the steel plates and in contact with the steel blocks with the help of PTFE slides. Note that for installation convenience, small gaps between the steel blocks and the hemispheres are allowed. There are circular holes at the vertex of each triangular plate and center of each hemisphere to allow for bolted connections. Earthquake-induced lateral forces in superstructures are transferred from the upper part to the lower part through contacts between the hemispheres and steel blocks. Triangular plates can be made of steels that are commonly used in bridges with desired strengths and stiffness.
2.3. Theoretical mechanical properties
As illustrated in Fig. 1(d) and (e), considering a lateral force F acting on the vertex of one triangular plate through the hemisphere, the edge stress, \sigma, of any section that is x meters away from the vertex can be determined as follow:
where B, H and t is the width, height and thickness of the steel plate, respectively. Based on the assumption that the section edge stress along the plate height is identical, the yielding force, F_y, of the TSD can be expressed as Eq. (2).
where \sigma_y is the yielding stress of the steel plate. The edge curvature of the plate section \phi_y is determined using Eq. (3).
where M_y is the elastic moment capacity of the cross-section and E is Young's modulus of steel. The yielding displacement of triangular plate at vertex, x_y, can be calculated by integrating edge curvatures along the plate vertical depth, h.
Combining Eqs. (2) and (4), the secant stiffness of the TSD, K_y can be determined as:
The ultimate displacement capacity of the triangular plate at its vertex is nearly 10 to 15 times of its yielding displacement, as observed in past experiments9. This assumption serves as the reference in the preliminary design phase, which is detailed later in this paper.
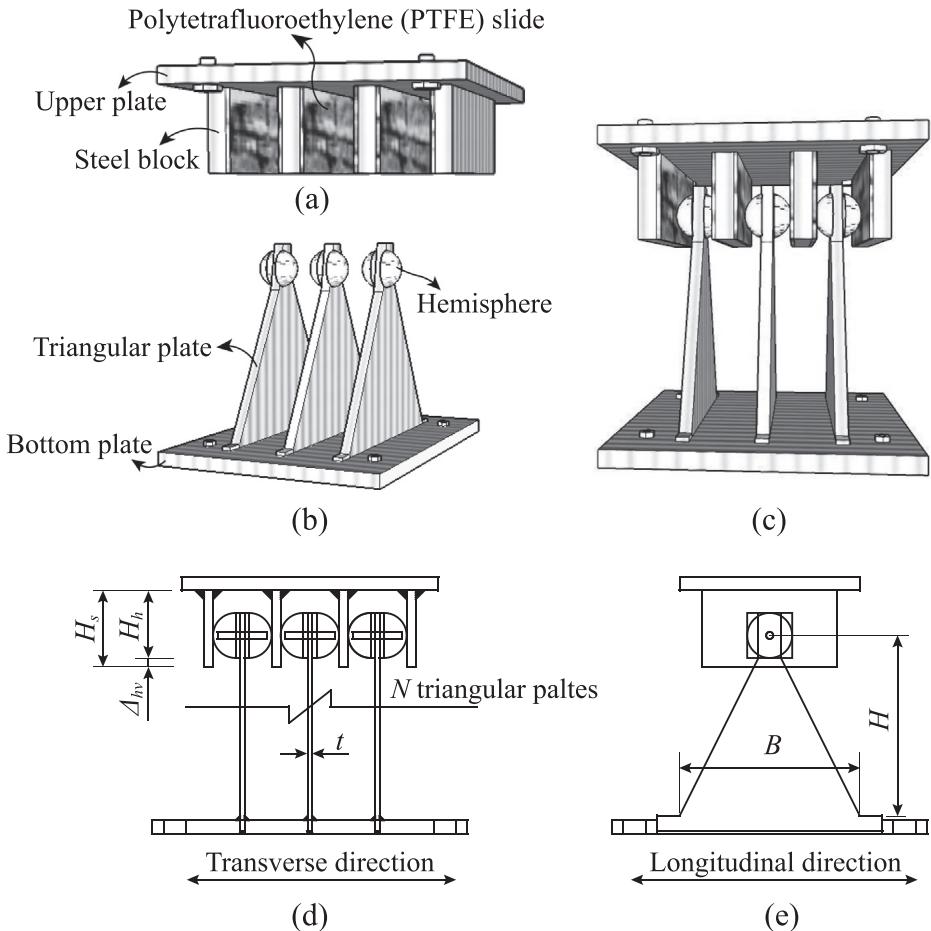
Fig. 1. Configuration and detail of the Transverse Steel Damper (TSD): (a) Upper part, (b) Lower part, (c) Assembling, (d) Front elevation and (e) Side elevation.
2.4. Pseudo-static experiments and numerical simulations
Pseudo-static tests and corresponding numerical simulations on two test groups of TSD specimens were conducted. For the first test group, the purposes were to verify the energy dissipation and displacement capacities of the TSD, as well as the reliability of connections between the upper part and the triangular steel plates, i.e. the bolted hemispheres. As such, it was possible to use scaled-down specimens for the tests since they produce similar results as the full scale prototypes. The purpose of the second test group focused on seismic behaviors of TSD on real-world long span bridges. To this end, full-scale specimens were tested for this group.
2.4.1. Two scaled specimens
Fig. 2 shows the test setup for the scaled specimens. Specifically, two specimens (A and B) with different material properties were tested. Each specimen consists of three triangular plates. Specimen A and B were made of Q345-B and Q235-B steel materials, respectively, both of which have been commonly used on transportation projects in China. The letter 'B' in the material denotation indicates that the steel meets the requirements of impact strength test at a temperature of 20^{\circ}\text{C}. The triangular plates for specimens are 0.4\text{m} in height (H), 0.4\text{m} in width (W) and 0.01\text{m} in thickness (t). Pseudo-static experiments were conducted in the Earthquake Engineering Laboratory of Tongji University in Shanghai, China. A hydraulic actuator with a maximum capacity of 15 tons was used to provide lateral cyclic loading. The actuator was bolted to the TSD at the upper part. Four steel plate legs were installed to simulate the connection between the TSD and the girder. Rollers were placed at the bottom of these legs so that the upper part of the TSD can slide back and forth under cyclic loading. Steel laminas with smooth surface were placed under the rollers to reduce friction. The friction contribution from the test setup itself was recorded when only upper part and the legs were loaded. A lead block weighing 2.5 tons was placed on top of the TSD to avoid warping of the upper part. After installation, gaps of approximate 5\text{mm} wide existed between the steel blocks and the hemispheres. 13 strain gauges were glued onto one surface of each triangular plate shown in Fig. 3(a). Displacement-controlled cyclic loads were applied during the test, and specimens were loaded three cycles for each displacement amplitude.
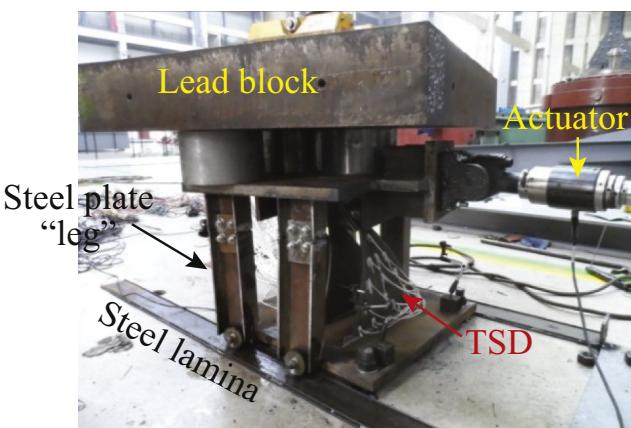
Fig. 2. Scaled specimens and test set up.
Hysteresis curves obtained from tests are shown in Fig. 4 along with the backbone curves. It is worth to note that the hemispheres of specimen A practically disengaged with the steel blocks at a displacement amplitude of 160\text{mm} or more, because of insufficient heights of the steel blocks. In this regard, a provision on the height of the steel block (H_s)of the TSD is proposed and illustrated in Fig. 1(d); that is H_s = H_h + \Delta h_{\nu}, where H_h is the distance from the bottom of hemispheres to the bottom of the upper plate, which is determined based on the height of the triangular plate (H) and the pier-deck vertical distance; \Delta h_{\nu} is vertical displacement of the hemispheres when the TSD is subjected to the ultimate lateral displacement, which can be obtained through calibrated numerical analysis described later in this paper. This provision on heights of triangular plates ensures a reliable contact between the hemispheres and the steel blocks.
After the displacements reached 160\text{mm}, the loading was subsequently switched to a monotonic push to 200\text{mm}. No damage was observed from surfaces of the triangular plates and no strength degradation was recorded. For Specimen B, similar disengaging phenomenon occurred when the specimens were displaced to 200\text{mm} before a monotonic push to 240\text{mm}. Strength degradation was observed, whereas apparent damage was not observed.
As can be seen in Fig. 4, hysteresis curves for both Specimens A and B exhibit a plump shape with large enclosed areas, indicating excellent energy dissipation capacities. Also, backbone curves of both Specimens A and B show a bi-linear pattern, which implies that the mechanical property of the TSD can be determined using a bi-linear relationship. When Specimen B (Q235B) was pushed to 240\text{mm}, the strength degradation occurred. Specimen A (Q345B) that was pushed to 200\text{mm}, and did not show any visible damage in the triangular plates or any strength degradation in their hysteretic responses. The test of Specimen A was terminated when dimension constraints were reached, although a larger displacement capacity was expected. The recorded displacement drift ratios (displacement/plate height) of Specimens A and B both exceeded 50\%. This result demonstrates that the TSD has excellent energy dissipation and displacement capacities.
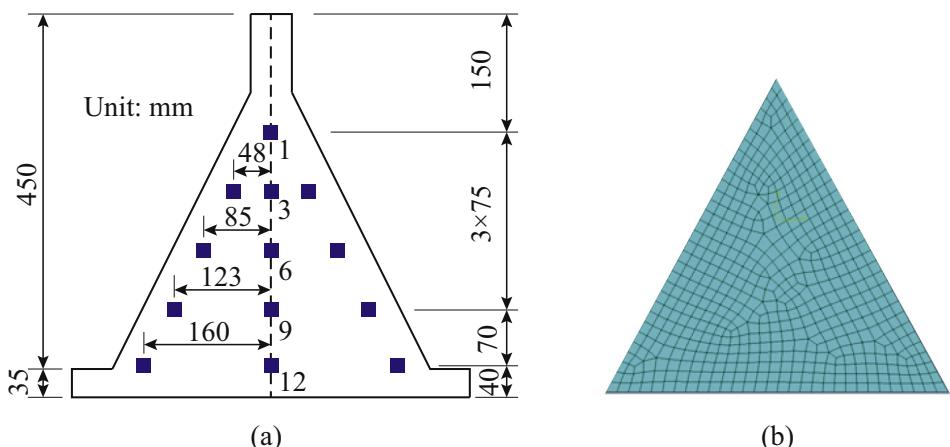
Fig. 3. Experimental and numerical illustrations of the steel plate: (a) dimensions and layout of strain gauges, and (b) numerical model in ABAQUS.
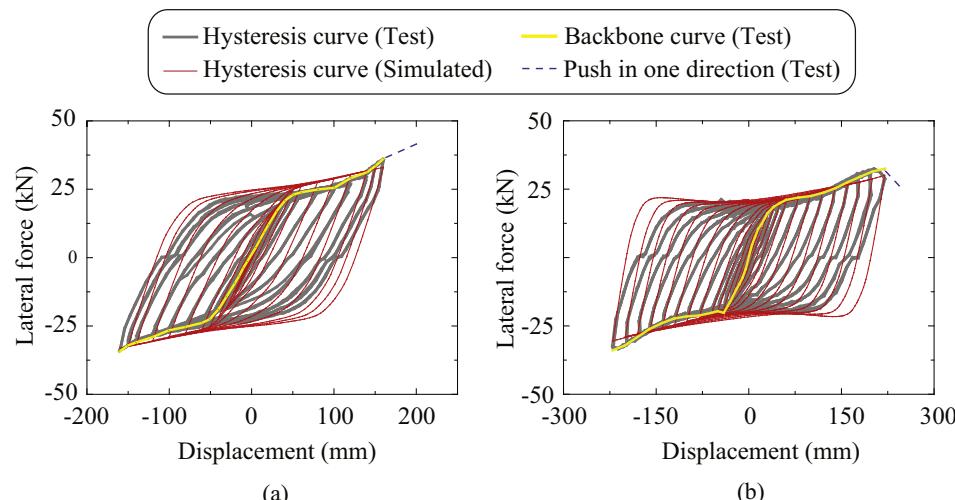
Fig. 4. Test and simulated lateral force and displacement relationships: (a) Specimen A and (b) Specimen B.
Simulated hysteretic and backbone curves from ABAQUS models are also plotted in Fig. 4 for comparison. In the numerical models, shell elements are used and the meshes are shown in Fig. 3(b). Parameters include dimensions and mechanical properties of the triangular plate (yielding strengths of 235\text{MPa} and 345\text{MPa} and hardening ratios of 0 and 0.02 for Specimens A and B, respectively, and Young modulus of 206\text{GPa} for both specimens). It was assumed in the numerical simulation that all triangular plates deform synchronously and equally share the lateral forces from the actuator. In general, the simulated results coincide well with the test results. Specifically, during the ascending stages of the hysteretic curves, deviations are within 10\%. In the descending portions of the curves, larger deviations were observed, which may be because of the undetectable gaps between the hemispheres and steel plates. This gap became noticeable when the actuator pushed back, which is reflected as a flat line (approximately from displacements of 50 to 100\text{mm}) in Fig. 4. Nevertheless, this phenomenon has minor influence on the overall seismic behaviors of the TSDs.
Torsional displacement of the actuator was not obvious at small loading displacements, thus the strain gauge records at the same elevation are practically identical. Fig. 5 presents the recorded strain distribution along the steel plate. Note that the strain shown in Fig. 5 were obtained from the gauges distributed along the center line of the steel plate (points 1, 3, 6, 9, 12), which were least affected by torsional displacement of the actuator. Note that most of the strain gauges failed when the loading amplitudes reached 120\text{mm}.
As can be seen in Fig. 5, at small displacements, strains at the bottom of the triangular plates are larger than those at other locations. However, at large displacements, strains at the top of the triangular plates are the greatest. Also, they gradually decrease from the top to the bottom along the center line, which may be due to the friction between the hemispheres and the vertices of the triangular plates at large loading amplitudes. Nonetheless, the strain magnitudes at different locations are quite close in general, which confirms: (1) the cross-sections of the triangular plates along the height approximately yielded simultaneously and (2) the adopted triangular-shaped steel plates had a quite good material utilization rate. Fig. 6 shows the deformation of the TSD, represented by Specimen B, at the end of the monotonic push. Apparently, all triangular plates deformed synchronously even when the strength of the TSDs decreased. This phenomenon verified the assumption of synchronous deformations and equal force-bearing in the numerical models mentioned above. Based on the experimental and numerical results of the first group of specimens, it can be concluded that the proposed TSDs possess good energy dissipation and displacement capacities.
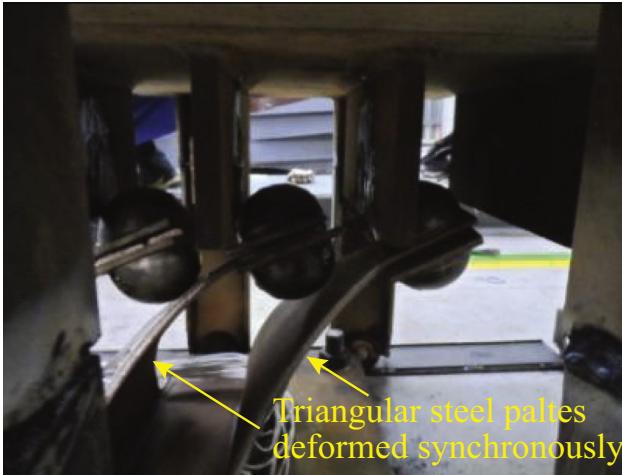
Fig. 5. Recorded strain distribution along the central line of a plate: (a) Specimen A and (b) Specimen B.
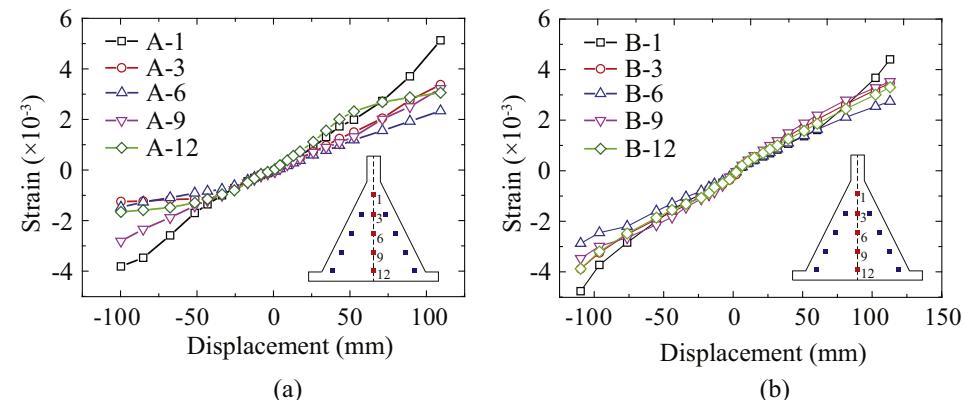
Fig. 6. Deformation of Specimen B when lateral force degraded.
2.4.2. Two full-scale specimens
In order to achieve large displacement capacities of TSDs for actual long span bridges, the height of steel blocks and distance between adjacent triangular plates were modified for the specimens in the second group. Two specimens (named C and D) with different dimensions were fabricated using the Q345-E steel to achieve higher strengths and displacement capacities as theoretically suggested by Eqs. (2) and (4). The letter 'E' in Q345-E indicates that the material meet the impact test strength requirements at -40^{\circ}\text{C}. This type of steel can improve the ductility of triangular plates, resulting in larger displacement capacities. Specimens C and D have the same height of 0.55\text{m} and thickness of 0.03\text{m} and different width of 0.6\text{m} and 1.0\text{m}, respectively. Both specimens consist of 3 triangular plates. The loading scheme was kept the same as the first group of tests except that a 10 tons lead block was placed on top of the upper part and a 50-ton-capacity actuator was used. Fig. 7(a) shows the test setup for Specimen D.
As plotted in Fig. 7(b), unexpected shear failures of the bolts used for connecting the hemispheres and triangular plates occurred at displacement amplitudes of 220\text{mm} and 160\text{mm} for Specimens C and D, respectively. In the tests, 10\text{mm}-diameter bolts with steel material of M10.919, which has an ultimate tensile strength of 1000\text{MPa} and a ratio of yielding to ultimate tensile strengths of 0.9, were used. As illustrated in Fig. 7(c), under large lateral deflection, the bolt may be subjected to large shear forces. The unexpected shear failure comes from the underestimated lateral deflection of the steel plates before tests. Therefore, a simplified design method is proposed to prevent this shear-failure mode. In theory, strength of the bolt can be estimated by \tau_b = F_b / A_b = 4F_b / \tau \pi d_b^2, where d_b is the diameter of the bolt and F_b is the shear force acted on the bolt. For conservative and convenient considerations, F_b can be replaced by the lateral force on the steel plate, F (ignore the rotational angle of the hemisphere, \alpha). Based on the above analysis, it is suggested that the bolts should have larger diameters (e.g. 30\text{mm}) instead of 10\text{mm} as adopted in this test.
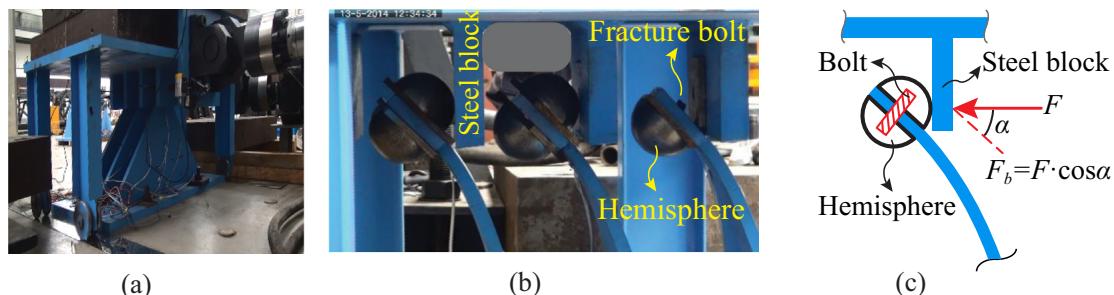
Fig. 7. Pre- and post-test phenomenon of Specimen D: (a) test setup; (b) deformations when the bolts fractured and (c) forces on the bolt for large deformations.
Again, it is worth to note that structural damage and strength degradation of the triangular plates were not observed during the tests. Besides, when bolts in Specimens C and D were fractured, maximum strains at the center points of the bottom sections were 50 times and 30 times of the steel yielding strains for Specimens C and D, respectively. This result demonstrates that the Q345-E steel has sufficient ductility to meet requirements of large displacement capacities of TSDs for long span bridges.
Fig. 8 exhibits the hysteretic and backbone curves of Specimens C and D from the tests along with the numerical results derived from ABAQUS for comparisons. The hardening ratios for the two specimens were set to 0 in the numerical models, which is equal to that for Specimen A in the first group due to the elastic perfectly-plastic assumption. Generally, the simulated results coincide well with their recorded counterparts. Furthermore, the backbone curves of Specimens C and D can be represented by a bi-linear constitutive function. It can be concluded that the numerical models in ABAQUS are capable of predicting the constitutive models of TSDs with various design parameters (e.g. material strength, height, width and thickness).
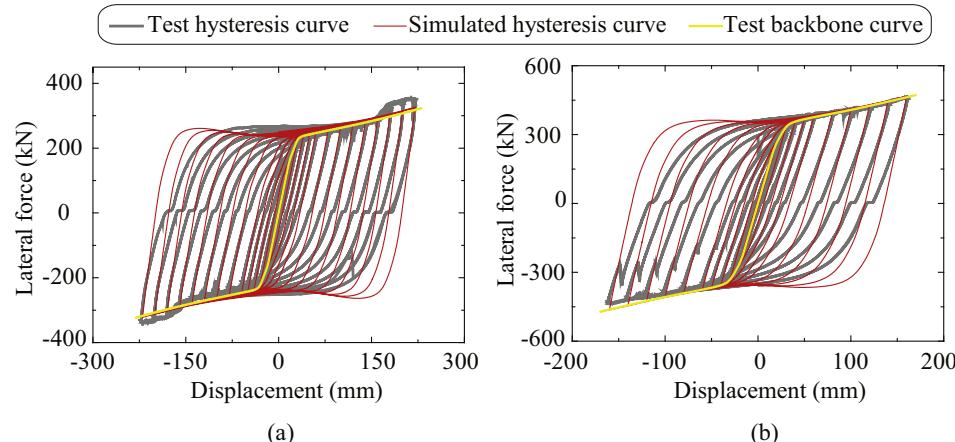
Fig. 8. Test and simulated lateral force and displacement relationships: (a) Specimen C and (b) Specimen D.
3. Design approach of TSD seismic system
3.1. System configurations
Based on the mechanical properties of TSDs, a TSD seismic system combining TSDs with sliding bearings is proposed in this paper to tackle the existing transverse seismic issues for long span bridges. Sliding bearings are used to transfer vertical load from the superstructure to the substructure. "Fuse bolts" are installed in the sliding bearings to resist transverse loads (e.g. winds and vehicles) at normal operational conditions. In other words, the sliding bearings act as fixed bearings in presence of the "fuse bolts". When designed earthquakes occur, the "fuse bolts" will fracture, and the bearings become sliding. The TSDs start resisting seismic loads. In this way, TSDs are free from fatigue issues under normal operational conditions. However, it should be noted that when the TSDs deform under earthquakes, low cycle fatigue may be an issue, which is out of the scope of this paper. Future experimental studies will take these issues into considerations. However, the low cyclic fatigue issue may be solved by limiting TSDs' capacity of lateral displacements. The TSD can dissipate seismic energy in the transverse direction, and accommodate longitudinal girder movements as well. Fig. 9 shows the configuration of the TSD seismic system. Steel plates are installed at the bottom of girders and top of piers, and anchor bolts are used to attach the TSDs to the girders and piers. Based on the test results, a maximum gap of 5\text{mm} between the steel blocks and hemispheres is allowed for the ease of installation.
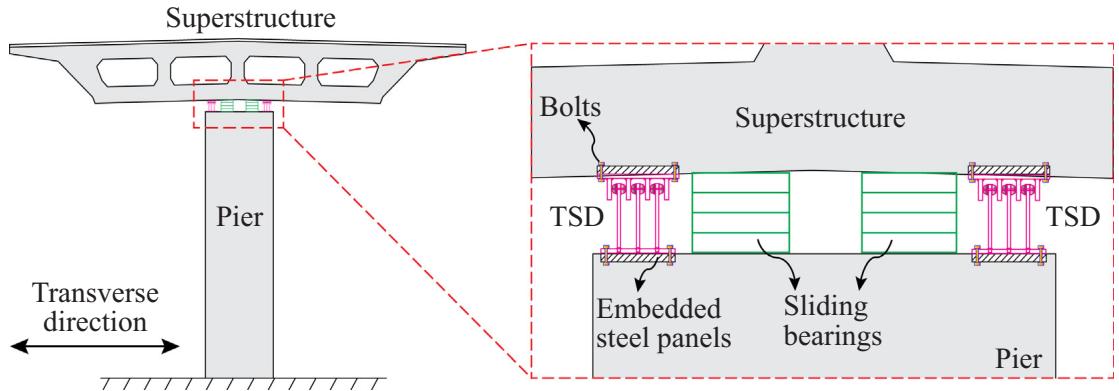
Fig. 9. Configuration of the TSD seismic system.
3.2. Constitutive models
The constitutive model for the new seismic system can be determined by combining models of TSDs with sliding bearings in parallel as illustrated in Fig. 10. Specifically, in the TSD model shown in Fig. 10(a), K_{1d} and K_{2d} represent elastic stiffness and post-yielding stiffness, respectively; X^d_y and X^d_u are yielding displacement and ultimate displacement, respectively; F^d_y and F^d_u are the yielding strength and ultimate strength, respectively. The sliding bearings are simulated by using elastic perfectly-plastic models shown in Fig. 10(b), where K_b is the elastic stiffness; F^b_y and X^b_y are the maximum static friction force (normally 10\% of vertical bearing capacities) and corresponding displacement (set as 2\text{mm}), respectively. Note that the constitutive models of the sliding bearings are obtained based on known vertical loads on piers. According to the principle of superposition, The TSD seismic system can be simulated using tri-linear constitutive models, as expressed in Fig. 10(c), with variables defined in Eq. (6).
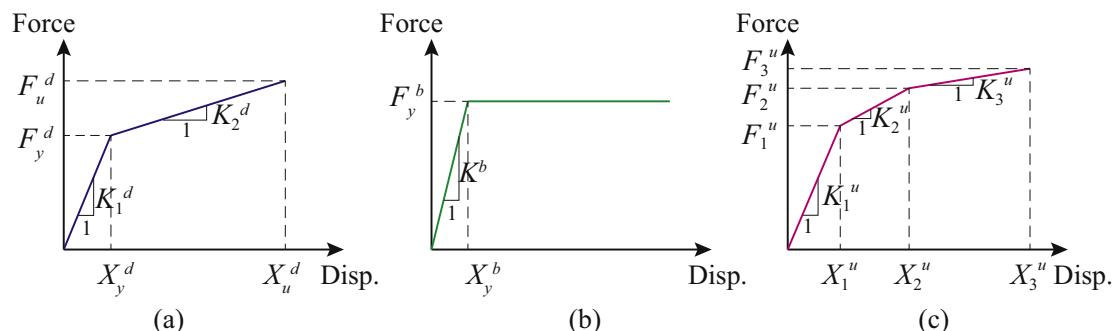
Fig. 10. Derivation of mechanical model for the TSD seismic system: (a) TSD, (b) sliding bearing and (c) TSD seismic system.
3.3. Design process
The design of the TSD seismic system focuses on optimization. Key design variables are (1) dimensions of a single triangular plate (i.e., height, width and thickness) (2) configurations of the TSDs (i.e. number of plates and space limits) and (3) material mechanical properties of the steels (i.e. Young modulus, yielding strength and hardening ratio). Based on the calibrated numerical models in ABAQUS, the constitutive models of the TSDs can be calculated. It should be noted that several constraints must be considered to determine these variables: (1) Ultimate displacements of TSDs, X^u_3, shall not exceed the maximum bearing displacements of bridges using the Sliding System (i.e. without TSDs), X_{max}^{sliding}. However, they should be larger than a prescribed limits on relative displacements between girders and piers, X_{max}^{objective}, which are normally determined by engineering judgements associated with economic considerations; (2) Yielding strengths of TSDs, F^d_y, should be larger than shear capacities of sliding bearings provided by the "fuse bolts", normally 10\% of the vertical bearing capacity, W, and smaller than seismic capacities of substructures, F_{sub}, to avoid pier failures; It is worth to note that the requirement of F^u_1 \ge F^b_y ensures a full elastoplastic loading procedure for the TSD; and (3) Limited installation spaces between girders and piers; that is dimensions and numbers of triangular plates should be less than their maximum values (N_{max}, H_{max} and B_{max}). Eq. (7) summaries these requirements.
The yielding strength, displacement and ultimate displacement are functions of dimensions and material properties of a single triangular plate and the number of plates used, as expressed in the Section 2.3. In addition, to minimize the effect of welding residual stresses and to prevent the upper part of the TSD from colliding the triangular plates, spacing between triangular plates shall be taken as 5-10 times the thickness, as illustrated in Fig. 11.
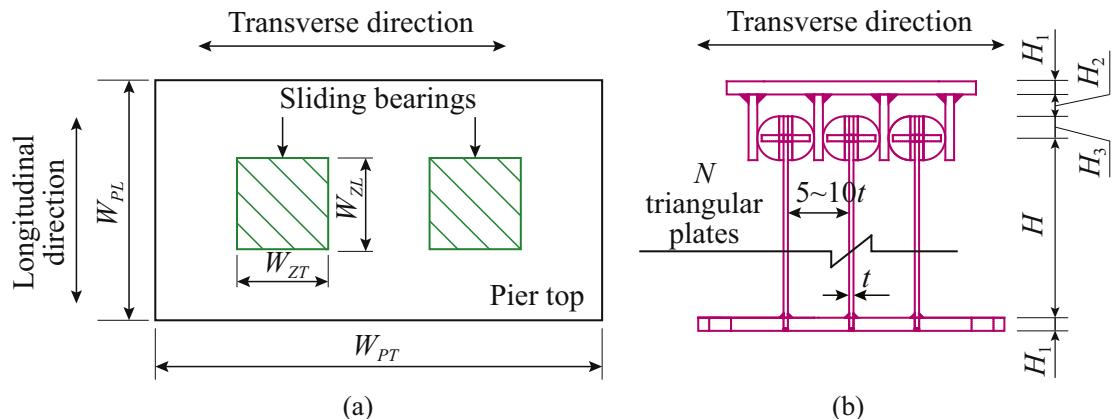
Fig. 11. Installation instruction of the TSD: (a) plane view of the pier and (b) side view of the TSD.
Fig. 11(a) shows the layout of commonly adopted double bearings on a pier top. For TSDs placed in one row along the transverse direction, the maximum number of plates is determined as N_{max,1} = (W_{PT} - 2W_{PT})/(5-10t) or W_{PT}/(5-10t), where W_{PT} and W_{ZT} are widths of the pier and bearings in the transverse direction. As for TSDs placed in multiple rows (m \ge 2), the maximum number of plates equals to m times N_{max,1}. Also, the total width of triangular plates should be less than the longitudinal width of the pier top, L_{PL}. For TSDs are placed in one column along the longitudinal direction, the maximum width of triangular plates, B_{max}, equals to (W_{PL} - W_{ZL}) or W_{PL}. As for m (m \ge 2) columns layout of TSDs, B_{max} equals to m \cdot (W_{PL} - W_{ZL}) or m \cdot W_{PL}. The height of triangular plates must be less than the distance between the girder and the pier top, H_s. Fig 11(b) illustrates the thickness of upper and lower plates, H_1, the gap between the top of hemisphere and the bottom of upper plate, H_2, and the radius of hemisphere, H_3. Therefore, the height of triangular plates H = H_s - \sum H_i (i=1, 2 and 3).
To meet abovementioned requirements, an optimized design procedure is adopted when determining the parameters of the TSD. Various integral solutions to the variable sets of \{H, B, t, N\} can be obtained based on the following priority levels:
- The ratio of B/H should be within the range of [2/3, 3/2] in order to achieve excellent energy dissipation properties.
- The number of plates N shall be as few as possible to simplify the installation procedure and meet the space constraints as well.
- Minimize material usage thus minimize the overall costs.
It should be noted that the derived integral variable sets of \{H, B, t, N\} are based on designed dimensions of bridge components such as piers and girders. In other words, they are preliminary values for the design of the TSD seismic system. To assure its effectiveness on the seismic performance of long span bridges, Seismic Parameter Analyses (SPA) are conducted to determine the optimal variable set of \{H, B, t, N\}. The full design process of the TSD can be summarized into a flow chart given in Fig. 12. For convenience, one set of \{H, B, t\} from the preliminary sets of \{H, B, t, N\} is adopted to calculate the constitutive model of a single triangular plate. After that, SPA are performed on bridge models with different TSDs that have various numbers of triangular plates, N. Seismic demand parameters such as transverse displacement between girders and piers, and internal forces of piers are compared to achieve the optimal N. Note that the derived optimal N is re-checked for space constraints.
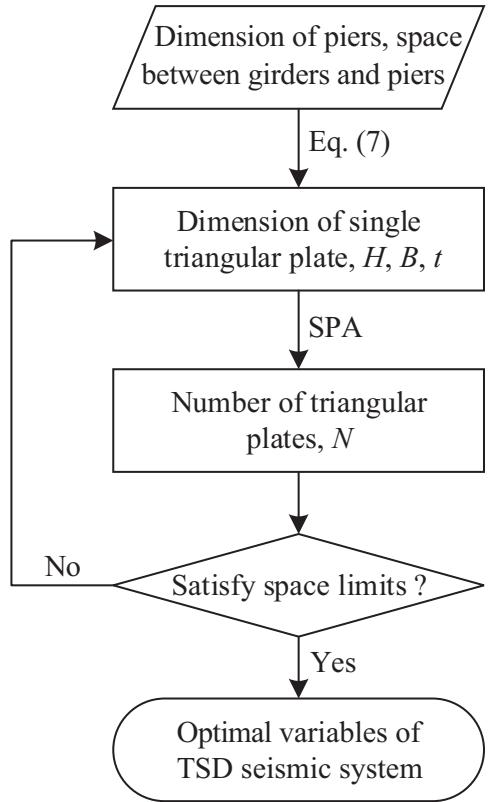
Fig. 12. Design flow chart of the TSD seismic system.
4. Case study: Implementation of TSD seismic system in a long span cable-stayed bridge
To evaluate the feasibility of aforementioned design approach, a case study on an actual cable-stayed long span bridge was performed. There are two main reasons to choose cable-stayed bridges as the subjects of the case study. Firstly, many cable-stayed bridges have been built or will be built in China. A data collection of 55 as-built cable-stayed bridges shows that 78\% of them are long span bridges with main spans beyond 400\text{m}20. Secondly, as mentioned before, there are lack of mechanically simple and seismically efficient devices for energy dissipation of cable-stayed bridges in transverse direction. This case study aims to obtain the optimal variables of the TSD seismic system to balance seismic forces of substructures and relative movements between girders and piers under earthquakes.
4.1. Adopted bridge model
The adopted bridge model is a double-tower longitudinally floating cable-stayed bridge with a main span of 620\text{m} and two side spans of 218\text{m} and 77\text{m}, respectively. As seen in Fig. 13, the steel box girder is supported by two diamond-shaped reinforced concrete (RC) towers, two RC transitional piers (side piers) and two RC auxiliary piers (piers which are placed near towers). The diamond-shaped RC towers have heights of 210\text{m} (155\text{m} above the girder). Each pier consists of two 45\text{m}-tall RC columns that are joined by RC caps. The column has a hollow rectangular section that has out-to-out dimensions of 3.5\text{m} and 6.5\text{m} in the longitudinal and transverse direction, respectively. Pile group foundations consist of 10 drilled piles with diameters of 2.85\text{m} and lengths of 110\text{m}.
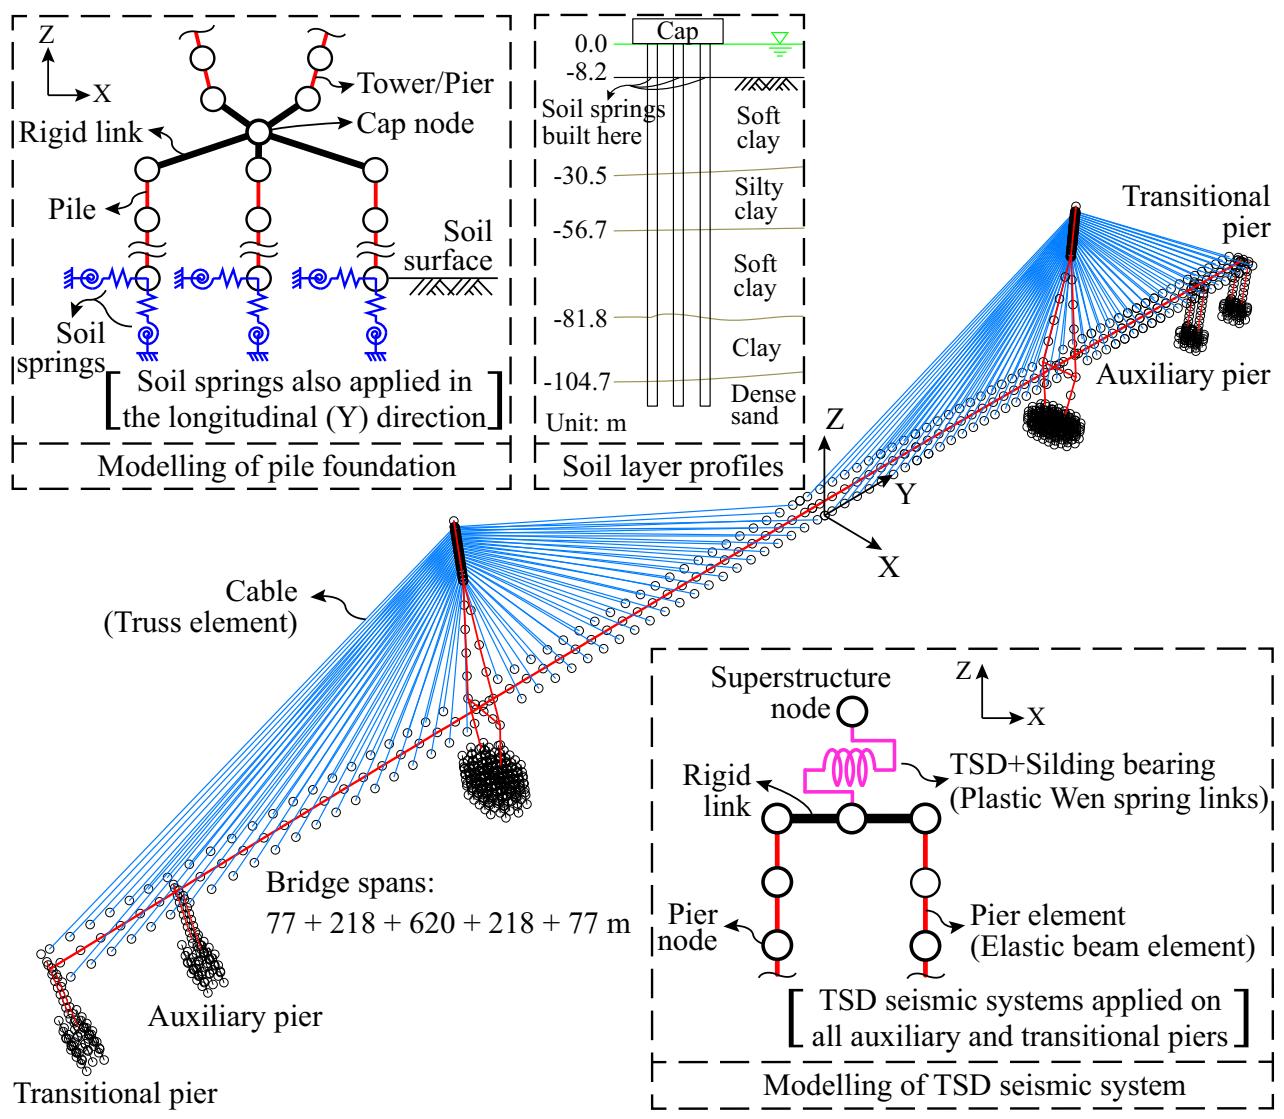
Fig. 13. Finite element model of the cable-stayed bridge for case study.
A three-dimensional finite element model is developed in SAP2000. The steel box girder, RC piers and towers are modeled using elastic beam elements. Cables are simulated by truss elements with an elastic modulus that accounts for the sag effects21. Nonlinear geometric effects were taken into consideration as well. Note that before time history analysis, the gravity analysis induces large tension forces in the cables, which prevent the cables to become slack under seismic loads. In the longitudinal direction, connections between the girder and the piers (towers) allow for free movements, i.e. it is a floating system. In the transverse direction of transitional and auxiliary piers, sliding bearings and TSDs are represented by Plastic Wen units in SAP2000, which can provide bilinear constitutive models. Note that the constitutive models of TSDs are determined by ABAQUS based on the calibrated models derived from quasi-static tests. The girder is fixed in the transverse direction at the tower locations by elastic link element with large stiffness. The elevated pile groups are modeled using elastic beam elements along with elastic soil springs at scoured soil surfaces22. The ground has properties of soft soils as illustrated in Fig. 13. Translational and rotational stiffness of the soil springs are calculated based on the soil and embedded pile properties as described in23. The Hilber-Hughes-Taylor iterative method24,25 is employed to integrate the coupled nonlinear dynamic system in SAP2000. Three key parameters for this method, gamma, beta and alpha, are 0.5, 0.25 and 0, respectively.
4.2. Numerical model validation
To validate the numerical model, fundamental natural periods of the selected cable-stayed bridge were evaluated and compared with their recorded counterparts from ambient vibration tests. It should be noted that the as-built bearing systems are fixed in the transverse direction. Therefore, transverse fixed bearings were set in the numerical model (without TSDs) to obtain its fundamental natural periods. From the numerical model, first three fundamental periods are estimated as 10.14\text{s} (longitudinal), 4.91\text{s} (transverse), and 3.96\text{s} (vertical), which are quite close to results from site ambient vibration tests: 10.00\text{s}, 4.35\text{s} and 3.57\text{s} in the longitudinal, transverse and vertical directions, respectively26. The minor deviations may come from uncertainties in structural dimensions or material properties from the actual construction. In general, the numerical model is capable of capturing dynamic characteristics of the cable-stayed bridge.
In addition, it is worth to show the effects of TSDs on the fundamental natural periods of the bridge. To this end, TSD seismic systems with 8-triangular-plate TSDs were applied to all of the transitional and auxiliary piers in the bridge model. The transverse fundamental period became 5.19\text{s}, which is about 6\% larger than that of the fixed system. Meanwhile, installations of TSDs have negligible effects on the longitudinal and vertical fundamental periods of the bridge.
4.3. Ground motions
As prescribed in the Chinese Guidelines for Seismic Design of Highway Bridges27, 7 ground motions are adopted to obtain the average seismic demands. The 7 ground motions have a mean acceleration response spectrum coinciding with the design response spectrum related to site conditions. In this study, 4 site classifications: I, II, III, and IV (from stiff to soft) as prescribed in27 are considered. Also, based on the seismic intensity of the studied site27, designed response spectra with the peak ground acceleration (PGA) of 0.2\text{g} are adopted. Due to the lack of real ground motion records at this site, 4 \times 7 = 28 scaled ground motions from the Ground Motion Database of Pacific Earthquake Engineering Research Center are adopted to coincide with the design spectra of the 4 site categories, respectively, as plotted in Fig. 14. In general, mean spectra coincide well with their design spectra, respectively. Details on individual ground motions can be seen in Appendix Table 1.
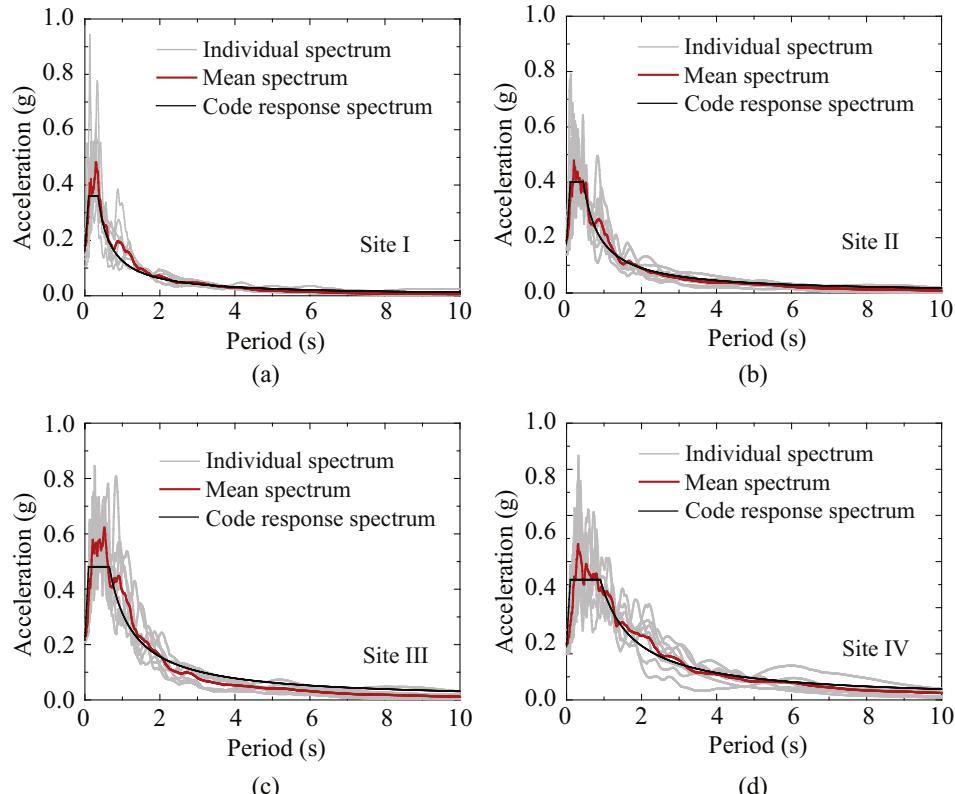
Fig. 14. Acceleration response spectra of adopted ground motions and corresponding design spectra for sites: (a) I, (b) II, (c) III and (d) IV.
4.4. Optimal variables of TSD seismic system
This section presents the optimization process of the TSD seismic system using time history response analysis. Focus of the study is on the optimal number of triangular plates in the TSD. 7 ground motions of the site IV were selected for running the time history response analysis. Individual ground motions were inputted into the cable-stayed bridge model in transverse and vertical directions simultaneously. The reason for choosing Site IV ground motions is that, compared with three other sites, it has a wider range of predominant periods, i.e. wider plateau in the design acceleration response spectrum, which is closer to the transverse fundamental period of the bridge, resulting in greater seismic demands. As a result, the designed TSD will have larger displacement capacities, which can cover those based on seismic inputs of other three site conditions. Nevertheless, it is worth to investigate the effects of different site conditions on the seismic performance of the TSD seismic system hereinafter.
Before conducting parametric analyses with TSD seismic systems, time history analyses were performed with sliding bearing systems to obtain maximum relative transverse displacement between the girder and the bearings, which were used as the upper limit for the transverse deformations of TSD seismic systems. In this study, the maximum bearing displacement of the sliding system is X_{max}^{sliding} = 1.32\text{m} at the transitional pier. Therefore, as expressed in Eq. (7), the displacement capacity of the TSD, X^u_3, should be less than 1.32\text{m}. Meanwhile, since this cable stayed bridge is a main component in the urban transport network, engineering judgements associated with economic considerations were used to set a lower limit of the displacement capacity, X_{max}^{objective} = 0.35\text{m}, for the TSD. In other words, the displacement control objective of 0.35\text{m} is set to ensure the seismic demand of girder-pier relative displacement is less than 0.35\text{m} under designed earthquakes. Besides, sliding bearings adopted in the bridge have the vertical bearing capacity of W=10\text{MN}. Based on Eq. (7), the yielding strength of the TSD should be greater than 0.1 W (i.e. 1\text{MN}). Furthermore, upper limits of space requirements in Eq. (7) are determined by the as-built dimensions of the cable-stayed bridge.
One set of TSD variables, in which H=0.8\text{m}, B=1.2\text{m} and t=0.03\text{m}, meets the requirements of Eq. (7). These variables, along with material properties (Q345-E), were input into the calibrated ABAQUS model to obtain the constitutive relationship of one single triangular plate, which, as illustrated in Fig. 10(a), consists of elastic stiffness of K_{1d}=5950\text{kN/m}, yielding displacement of X^d_y = 0.052\text{m}, yielding strength F^d_y = 312\text{kN}, displacement capacity X^d_u = 0.363\text{m}, hardening ratio of K_{2d}/K_{1d} = 0.075. Note that the displacement capacity of the triangular plate is determined as the vertex displacement of the triangular plate when the maximum strain along the plate reaches 50 times the yielding strain of Q345-E. For convenience, a base value of the number of triangular plates, N, was set as 4. Then, seismic responses of the bridge model using various cases of TSD seismic systems with N ranging from 4 to 28 at increments of 4 were examined. Note that in each case, the TSDs on the transitional and auxiliary piers had the same number of triangular plates.
Fig. 15 displays seismic responses of TSDs and piers in terms of N. Note that, N=0 represents the responses of the sliding system. In general, as can be seen in Fig. 15, N has significant effects on the seismic responses of the bridges, as well as the TSD itself. The following observations can be made from Fig. 15: (1) Deformation of the TSD decreases with increasing N, since the stiffness of TSD increases as N increases; (2) TSD transverse force and bending moments at the bottom sections of piers increase when N becomes larger since larger transverse forces were generated by more vertical plates; and (3) Shear force in the pier bottom sections, as shown in Fig. 15(c), is at its lowest value when N=4. When N>12, shear force in the pier bottom sections surpasses that of the sliding bearing system (N=0). The reason is that when N is small (e.g. 4), the TSDs can dissipate energy, decreasing the shear forces. However, TSD seismic systems with large N (e.g. >12) will generate large transverse shear forces. To meet the displacement control objective of 0.35\text{m} as described above and limit the transverse forces transferred to substructures, N=8 was finally selected as an optimal variable for the TSD seismic system. In summary, TSDs consisting of 8 triangular plates with dimensions of 0.8\text{m} in height, 1.2\text{m} in width and 0.03\text{m} in thickness are the optimal choice for seismic mitigation of the studied cable-stayed bridge. For other types of long-span bridges, such as suspension bridges, arch bridges or continuous girder bridges, optimal design variables of TSD seismic systems can be obtained using the same process presented above.
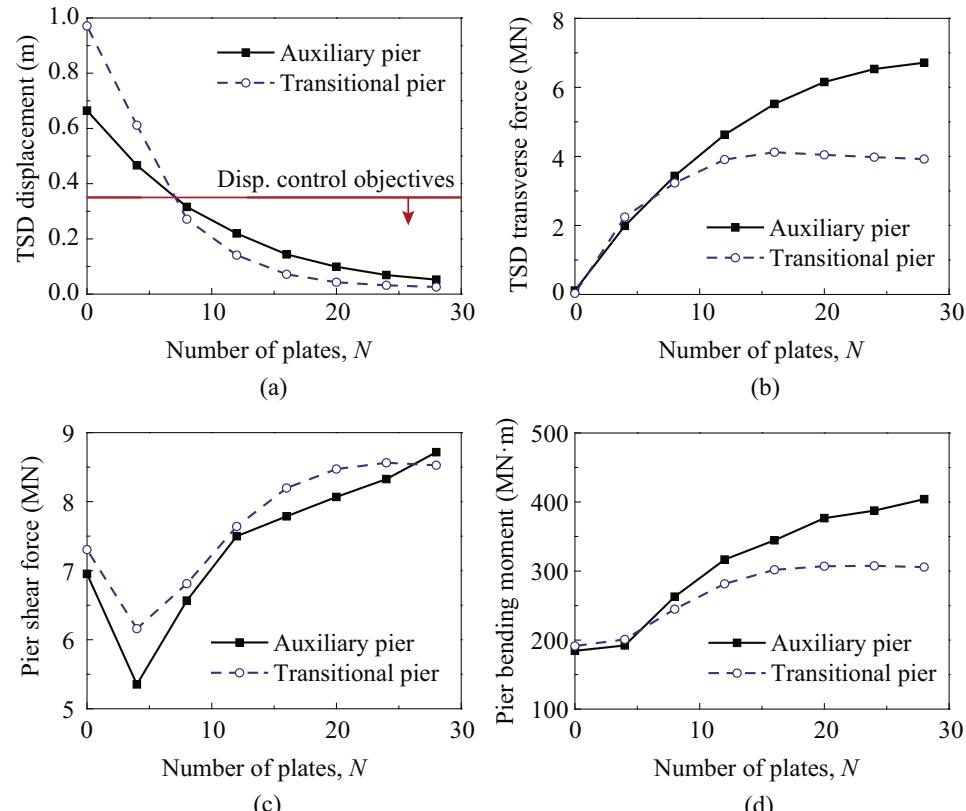
Fig. 15. Impact of triangular plate number on peak responses: (a) displacement of the TSD, (b) lateral force of the TSD, (c) Shear force at pier bottom and (d) Bending moment at pier bottom.
4.5. Performance of TSD seismic system
The performance of the TSD seismic system, based on the optimal variables of TSD, was further analyzed for the following three aspects in order to demonstrate its effectiveness for transverse seismic mitigation of long span bridges: (1) seismic demands on the bridge with or without the TSD seismic system; (2) energy dissipation properties of the TSD seismic system; and (3) impacts of seismic input characteristics on its performance.
4.5.1. Seismic demands
Force and displacement demands at critical locations of the bridge with the TSD seismic system (TS), sliding system (SS), or fixed system (FS) were compared. Note that abbreviations for three systems are used in the tables hereafter for convenience. Table 1 lists the maximum, minimum and average absolute peak girder-pier relative displacements of the bridge with TSD seismic system or sliding system under the 7 ground motions for Site IV. Note that a ground motion that generates a maximum peak response in a bridge with SS may not produce the same maximum peak response in a bridge with TS. Fig. 16 plots the time history results of pier-deck relative displacements under the Bakersfield ground motion (#403 in Appendix Table 1), which have the maximum peak displacement for the SS case among all 7 ground motions. As can be seen in Fig. 16, both the peak and residual displacements were significantly reduced in the proposed TS compared with the SS. Furthermore, from Table 1, it can be concluded that the TSD seismic system, compared with the sliding system, is capable of reducing the girder-pier relative displacements in the transverse direction. In average, the displacements at transitional and auxiliary piers of the sliding system were reduced to 27.9\% and 47.5\%, respectively, when TSD systems were used. Also, the TSD seismic system effectively reduces residual displacements in bearings at transitional and auxiliary piers, because the TSD provides relative large post-yielding stiffness compared with the sliding bearings in the sliding system. It should be noted that residual displacements may influence the performance of the slightly deformed TSD under aftershock excitations, but this is out of the scope of this paper. Nevertheless, for the cable-stayed bridge with longitudinal floating system and diamond-shaped towers, transverse residual displacements will be reduced in assistance of the cables after earthquakes. Also, deformed TSDs can be readily replaced after earthquakes.
Table 1 Girder-pier relative displacements from TSD seismic system and sliding system.
| Positions | Conditions | Peak displacement (m) | Residual displacement (m) | Ratio | |||
|---|---|---|---|---|---|---|---|
| SS (1) | TS (2) | SS (3) | TS (4) | (2)/(1) | (4)/(3) | ||
| Transitional pier | Maximum | 1.320 | 0.573 | 0.673 | 0.087 | 43.4% | 12.9% |
| Average | 0.971 | 0.271 | 0.323 | 0.005 | 27.9% | 1.60% | |
| Minimum | 0.639 | 0.038 | 0.074 | 0.004 | 5.90% | 5.00% | |
| Auxiliary pier | Maximum | 0.911 | 0.593 | 0.437 | 0.053 | 65.1% | 12.1% |
| Average | 0.665 | 0.316 | 0.182 | 0.005 | 47.5% | 2.80% | |
| Minimum | 0.451 | 0.080 | 0.026 | 0.021 | 17.6% | 82.7% |
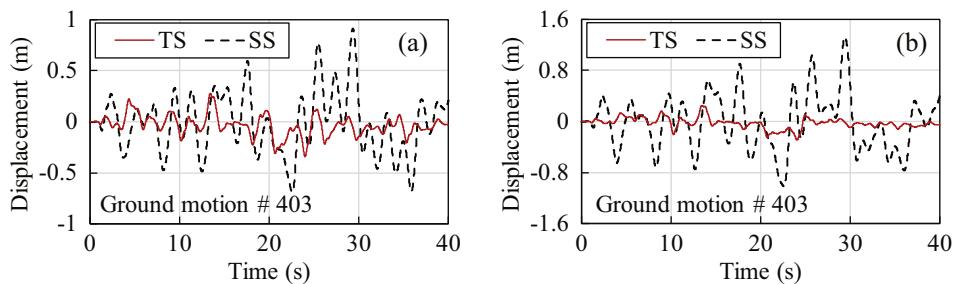
Fig. 16. Time history results of pier-deck relative displacement under the Bakersfield ground motion for SS and TS systems: (a) auxiliary pier and (b) transitional pier.
Besides, it is worth to mention that a bridge with TSD seismic systems experiences larger displacements at auxiliary piers than at transitional piers, while the results of a bridge with sliding systems are on the contrary. An explanation based on vibration mode shapes is provided herein. Fig. 17 illustrates transverse vibration modes of the girder using the TSD seismic system or the sliding system. Significant differences exist among them due to large differences of transverse stiffness of the bridge models using the TSD seismic system or the sliding system. Specifically, the vibration mode for the sliding system behaves simply as a transverse cantilever girder fixed at the tower, whereas the vibration mode for the TSD seismic system resembles a continuous girder fixed at the tower and the transitional pier and hinged to the auxiliary pier. Essentially, the TSD seismic system redistributes the stiffness between superstructures and substructures at transitional and auxiliary piers, which results in larger girder-pier relative displacements at auxiliary piers than those at transitional piers.
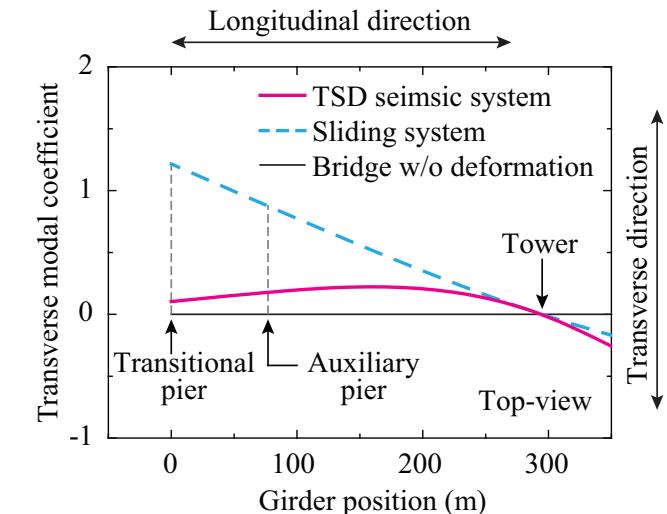
Fig. 17. Comparison between transverse predominant vibration modes of two seismic systems.
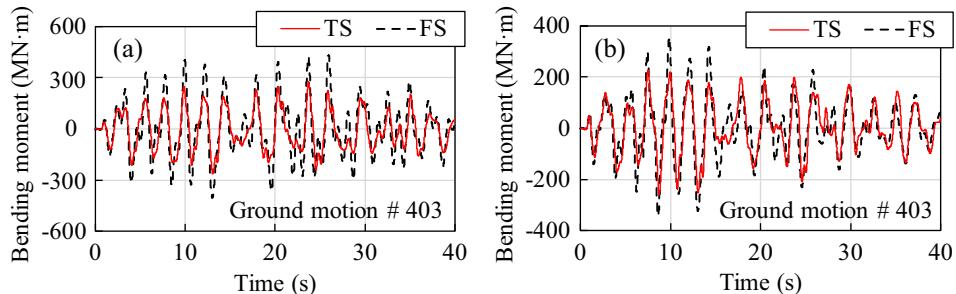
Table 2 gives the peak force demands of piers and towers from the average time history responses generated by the 7 ground motions. Note that TS and FS in the table correspond to the TSD seismic system and fixed system, respectively. Fig. 18 shows representative time history results of pier bending moment under the Bakersfield ground motion (#403 in Appendix Table 1) for the TS and FS. From a quick view of Fig. 18, in general, bending moments are moderately reduced in the TS compared with the FS. Based on Table 2, the TSD seismic system significantly reduces shear forces and bending moments in the transitional and auxiliary piers while having little effect on axial forces. By using the TSD seismic system, the peak shear force and bending moment of the auxiliary piers can be decreased by 33.9\% and 37.3\%, respectively, compared to the fixed system. Meanwhile, shear forces and bending moments on transitional piers are reduced by 22.7\% and 19.4\%, respectively. Moreover, little effect of TSDs has been observed on the seismic responses of towers because transverse fixed connections are adopted in both the TSD seismic system and the fixed system. Furthermore, it should be noted that the peak bending moment (419\text{MN}\cdot\text{m}) in auxiliary piers when using the conventional fixed system is slightly greater than that (418\text{MN}\cdot\text{m}) in towers. When the TSD seismic system is applied on piers, however, the bending moment significantly decreases (to 263\text{MN}\cdot\text{m}). Therefore, it can be concluded that the TSD seismic system can effectively mitigate seismic forces on transitional and auxiliary piers, improving the seismic performance of long span cable-stayed bridges.
Table 2 Force demands of from TSD seismic system and fixed system.
| Position | Axial force (MN) | Shear force (MN) | Moment (MN·m) | Ratio | |||||
|---|---|---|---|---|---|---|---|---|---|
| TS(1) | FS(2) | TS(3) | FS(4) | TS(5) | FS(6) | (1)/(2) | (3)/(4) | (5)/(6) | |
| Transitional piers | 7.36 | 7.50 | 6.81 | 8.81 | 245 | 300 | 98.2% | 77.3% | 81.6% |
| Auxiliary piers | 8.27 | 8.33 | 6.57 | 9.93 | 263 | 419 | 99.2% | 66.1% | 62.7% |
| Towers | 185 | 190 | 63.6 | 64.0 | 410 | 418 | 97.3% | 99.4% | 98.1% |
Fig. 18. Time history results of bending moments between TS and FS systems: (a) auxiliary pier and (b) transitional pier.
4.5.2. Energy dissipation properties
Fig. 19 shows force and displacement relationships and corresponding energy dissipations of the TSD and the sliding bearing in the TSD seismic system located at the auxiliary pier under the Bakersfield ground motion (#403 in Appendix Table 1). This ground motion has an acceleration response spectrum close to the design spectrum for Site IV. Apparently, the area enclosed by the TSD hysteresis curve is substantially larger than that enclosed by the sliding bearing hysteretic curve, which means a much larger energy dissipation capacity of the TSD than that of the sliding bearing. Here are some brief explanations for this observation. Lateral resistances (friction forces) of sliding bearings mainly depend on vertical loads applied on them. However, vertical loads in bearings at side piers (auxiliary and transitional piers) of long span bridges are commonly quite small due to cantilever casting constructions. As a result, energy dissipated by sliding bearings can often be neglected. In comparison, the proposed TSD seismic system can increase the transverse stiffness between girders and piers to improve energy dissipation capacities.
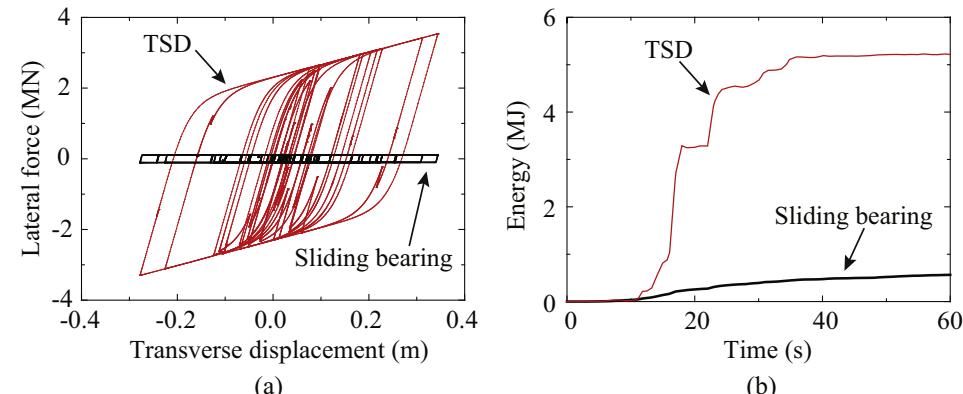
Fig. 19. Energy dissipation capabilities of the TSD seismic system: (a) force-displacement relationship and (b) time history of dissipated energy.
4.5.3. Impact of ground motion properties
Impacts of ground motion magnitudes on the seismic performance of the TSD seismic system were also studied. To this end, the one set of 7 ground motions for Site IV were scaled to three sets of new ground motions with PGA equals to 0.1\text{g}, 0.2\text{g} and 0.3\text{g}, respectively. These three sets of ground motions were inputted into bridge models using the TSD seismic system or the sliding system for comparison. Fig. 20 shows the bearing displacements of two studied systems in terms of PGA. In general, the TSD seismic system induces less transverse displacement than the sliding system under all three studied PGA levels. Approximate linear relationships are found between the displacement demands and the PGA levels. However, the sliding system shows greater gradient than the TSD seismic system: K_{ST} > K_{TT} and K_{SA} > K_{TA}, indicating that the TSD seismic system is less sensitive to PGA levels compared with the sliding system. This result implies that the TSD seismic system is favorable for bridges under unexpected large earthquakes. Moreover, the sliding system experiences apparent different responses at the transitional and auxiliary piers whereas the TSD seismic system at these two locations shows almost identical responses, representing a better distribution in deformation and energy dissipation among bridge components.
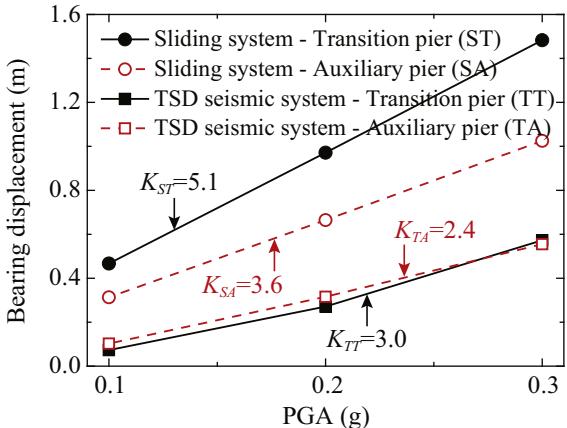
Fig. 20. Peak response of bearing displacement of the TSD seismic system and the sliding system.
Besides, influences of site categories on the seismic performance of the TSD seismic system were investigated using all the 28 ground motions described in the Section 4.3. Rather than establishing the relationship between structural responses and site classification numbers (I, II, III and IV), this study used a ground motion intensity measure to represent essential properties of the studied site categories. Sucuoglu and Nurtug28 stated that the ratio of PGA and peak ground velocity (PGV) represents characteristics of sites. Chai29 furtherly demonstrated that larger values of PGA/PGV represent stiffer soils. In light of these studies, the intensity measure of PGA/PGV was used as site classification indices.
Fig. 21 plots the bearing displacements at transitional and auxiliary piers of bridge models using the TSD seismic system or the sliding system in terms of PGA/PGV for various site classifications. In general, site classification numbers (I, II, III and IV) rise with decreasing PGA/PGV, which verifies that the adopted intensity measure of PGA/PGV is capable to distinguish characteristics of ground motions from various sites. The TSD seismic system triggers much smaller bearing displacement than the sliding system under each ground motion. In addition, the bearing displacement demands of the TSD seismic system under different site classifications vary within a quite small range (approximately 0-0.3\text{m}), which indicates that the TSD seismic system is insensitive to the site classification with regard to bearing transverse displacements.
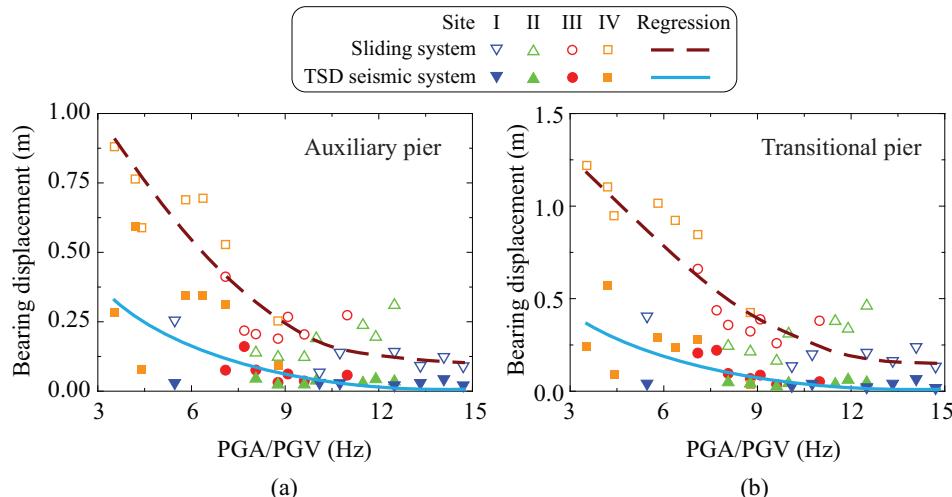
Fig. 21. Comparison on bearing displacements for different site classifications: (a) auxiliary pier and (b) transitional pier.
5. Concluding remarks and limitation
Considering the drawbacks of the conventional sliding and fixed systems used in the transverse direction of long span bridges, a seismic system combining Transverse Steel Dampers (TSDs) with sliding bearings was proposed. Pseudo static tests were conducted on 4 TSD specimens to verify their energy dissipation and displacement capacities. ABAQUS-based numerical models of the TSD specimens were calibrated by the test data. Furthermore, a design method for the TSD seismic system was proposed. The effectiveness of the TSD seismic system was validated through numerical analyses of a long span cable-stayed bridge in China. Based on the numerical results, the following conclusions were arrived at:
- The TSD seismic system is capable to balance transverse girder-pier relative displacements and forces of substructures under seismic excitations;
- In the TSD seismic system, the TSD contributes to most of energy dissipation capacities whereas the contribution of sliding bearings is negligible;
- The TSD seismic system is insensitive to the ground motion magnitudes (PGA) and the site classifications, whereas the conventional sliding system is quite sensitive to them.
A potential limitation of this study is on the issue of low cycle fatigue for the TSD, though experimental tests to date have not demonstrated that this would be an issue. Future experimental and analytical studies on this issue can be performed. In summary, the proposed TSD seismic system is capable of improving the seismic performance of long span cable-stayed bridges in the transverse direction. Also, it is reasonable to suggest that the proposed design approach for the TSD seismic system can be used for other types of long span bridges, such as suspension bridges, arch bridges and continuous girder bridges.
Acknowledgement
Funding for this study are provided by 973 National Basic Research Program of China (Grant No. 2013CB036302), the National Natural Science Foundation of China (Grant No. 51278375) and the State Key Laboratory of Disaster Reduction in Civil Engineering, Ministry of Science and Technology of China (Grant No. SLDRCE 15-B-05). Any opinions, findings, and conclusions expressed are those of the authors, and do not necessarily reflect those of the sponsoring organization.
Appendix A
Appendix Table 1
Selected ground motion records from PEER.
| # | Record sequence # | Earthquake | PGA (g) | PGV (cm/s) | Scale coefficient | Site classification | PGA/PGV (Hz) |
|---|---|---|---|---|---|---|---|
| 101 | 59 | San Fernando | 0.185 | 16.819 | 12.231 | I | 10.753 |
| 102 | 67 | San Fernando | 0.106 | 18.968 | 11.516 | I | 5.464 |
| 103 | 237 | Mammoth Lakes-03 | 0.225 | 17.683 | 3.209 | I | 12.500 |
| 104 | 238 | Mammoth Lakes-03 | 0.228 | 15.763 | 2.948 | I | 14.085 |
| 105 | 471 | Morgan Hill | 0.148 | 10.836 | 2.123 | I | 13.333 |
| 106 | 472 | Morgan Hill | 0.132 | 12.925 | 2.222 | I | 10.101 |
| 107 | 545 | Chalfant Valley-01 | 0.241 | 16.003 | 2.539 | I | 14.706 |
| 201 | 15 | Kern County | 0.191 | 18.735 | 1.072 | II | 10.001 |
| 202 | 40 | Borrego Mtn | 0.201 | 16.511 | 4.442 | II | 11.905 |
| 203 | 54 | San Fernando | 0.163 | 19.776 | 17.231 | II | 8.065 |
| 204 | 68 | San Fernando | 0.211 | 17.976 | 1.211 | II | 11.494 |
| 205 | 85 | San Fernando | 0.156 | 15.932 | 4.472 | II | 9.615 |
| 206 | 86 | San Fernando | 0.138 | 15.411 | 8.701 | II | 8.772 |
| 207 | 187 | Imperial Valley-06 | 0.271 | 21.314 | 1.327 | II | 12.473 |
| 301 | 6 | Imperial Valley-02 | 0.234 | 32.341 | 1.090 | III | 7.092 |
| 302 | 9 | Borrego | 0.221 | 19.787 | 5.006 | III | 10.989 |
| 303 | 12 | Kern County | 0.232 | 24.956 | 4.020 | III | 9.091 |
| 304 | 22 | El Alamo | 0.214 | 27.283 | 4.142 | III | 7.692 |
| 305 | 54 | San Fernando | 0.246 | 29.939 | 26.087 | III | 8.065 |
| 306 | 85 | San Fernando | 0.237 | 24.120 | 6.771 | III | 9.615 |
| 307 | 86 | San Fernando | 0.209 | 23.332 | 13.173 | III | 8.772 |
| 401 | 6 | El Centro Array #9 | 0.303 | 41.845 | 1.411 | IV | 7.092 |
| 402 | 36 | El Centro Array #9 | 0.199 | 46.359 | 3.510 | IV | 4.202 |
| 403 | 53 | Bakersfield - Harvey Aud | 0.247 | 41.703 | 34.121 | IV | 5.814 |
| 404 | 61 | Cholame - Shandon Array #8 | 0.220 | 61.234 | 38.872 | IV | 3.534 |
| 405 | 74 | Maricopa Array #1 | 0.248 | 55.330 | 22.982 | IV | 4.405 |
| 406 | 82 | Port Hueneme | 0.658 | 101.352 | 8.306 | IV | 6.369 |
| 407 | 86 | San Onofre - So Cal Edison | 0.270 | 30.185 | 17.042 | IV | 8.772 |
References
Chadwell C. Near-source earthquake on the Ji-Lu Cable-stayed Bridge in the 21 September 1999 Chi-Chi Taiwan Earthquake [Ph.D. thesis]. Berkeley: University of California; 2001. ↩
Chang KC, Mo YL, Chen CC, Lai LC, Chou CC. Lessons learned from the damaged Chi-Lu cable-stayed bridge. J Bridge Eng, ASCE 2004;9(4):343-52. ↩
Tsopelas P, Constantinou MC, Kim YS, Okamoto S. Experimental study of FPS system in bridge seismic isolation. Earthquake Eng Struct Dyn 1996;25 (1):65-78. ↩
Pecker A. Design and construction of the Rion Antirion Bridge. In: Proceedings of the conference on geotechnical engineering for transportation projects, GeoTrans. Los Angeles (USA): ASCE; 2004. ↩
Yao JT. Concept of structural control. J Struct Div, ASCE 1972;98(st 7):1567-74. ↩
Kelly JM, Skinner RI, Heine AJ. Mechanisms of energy absorption in special devices for use in earthquake resistant structures. Bull New Zeal Soc Earthquake Eng 1972;5(3):63-88. ↩
Skinner RI, Tyler RG, Heine AJ, Robinson WH. Hysteresic dampers for the protection of structures from earthquakes. Bull New Zeal Soc Earthquake Eng 1980;13(1):22-36. ↩
Skinner RI, Beck JL, Bycroft GN. A practical system for isolating structures from earthquake attack. Earthquake Eng Struct Dyn 1974;3(3):297-309. ↩
Skinner RI, Kelly JM, Heine AJ. Hysteresic dampers for earthquake-resistant structures. Earthquake Eng Struct Dyn 1974;3(3):287-96. ↩ ↩
Tyler RG. Tapered steel energy dissipators for earthquake resistant structures. Bull New Zeal Soc Earthquake Eng 1978;11(4):282-94. ↩
Tyler RG. Further notes on a steel energy-absorbing element for braced frameworks. Bull New Zeal Soc Earthquake Eng 1985;18(3):270-9. ↩
Parducci A, Mezzi M. Seismic isolation of bridges in Italy. In: Proceedings of Pacific conference on earthquake engineering. Auckland (New Zealand), November 1991. ↩
Marioni A. Development of a new type of hysteretic damper for the seismic protection of bridges. In: Proceedings of the 4th world congress on joint sealing and bearing systems for concrete structures. American Concrete Institute; 1997. p. 955-76. ↩
Aiken ID, Nims DK, Whittaker AS, Kelly JM. Testing of passive energy dissipation systems. Earthquake Spectra 1993;9(3):335-70. ↩
Perry CL, Fierro EA, Sedarat H, Scholl RE. Seismic upgrade in San Francisco using energy dissipation devices. Earthquake Spectra 1993;9(3):559-79. ↩
Tsai KC, Chen HW, Hong CP, Su YF. Design of steel triangular plate energy absorbers for seismic-resistant construction. Earthquake Spectra 1993;9 (3):505-28. ↩
Whittaker AS, Bertero VV, Thompson CL, Alonso LJ. Seismic testing of steel plate energy dissipation devices. Earthquake Spectra 1991;7(4):563-604. ↩
Fang Y. Research on typical damage of simple supported beam bridge during Wenchuan Earthquake and transverse restraint device [Ph.D. thesis]. Shanghai, China: Tongji University; 2012 [in Chinese]. ↩
Standardization Administration of China. GB/T 1231-2006 specifications of high strength bolts with large hexagon head, large hexagon nuts, plain washers for steel structures. Beijing: Standards Press of China; 2006 (in Chinese). ↩
Pang Y, Wang X, Shang Y, Wu L. Seismic fragility analysis of a typical two-pylon cable-stayed bridge in China: comparison of fragility models. In: Proceedings of the 7th civil engineering conference in the Asian Region. Hawaii (USA), August 2016. ↩
Thai HT, Kim SE. Second-order inelastic analysis of cable-stayed bridges. Finite Elem Anal Des 2012;53:48-55. ↩
Ingham TJ, Rodriguez S, Donikian R, Chan J. Seismic analysis of bridges with pile foundations. Comput Struct 1999;72(1):49-62. ↩
Ministry of Transport, China PR. JTG D63-2007 Code for design of ground base and foundation of highway bridges and culverts, 2007. [In Chinese]. ↩
Chopra AK. Dynamics of structures. Prentice Hall; 2001. ↩
Hilber HM, Hughes TJ, Taylor RL. Improved numerical dissipation for time integration algorithms in structural dynamics. Earthquake Eng Struct Dyn 1977;5(3):283-92. ↩
Su J, Li Z. Dynamic and static load test report for Jintang Bridge. Institute of Highway Science; 2009 [in Chinese]. ↩
Ministry of Transport, China PR. JTG/T B02-01-2008 Guidelines for seismic design of highway bridges. Beijing: China Communications Press; 2008 [in Chinese]. ↩ ↩ ↩
Sucuoglu H, Nurtug A. Earthquake ground motion characteristics and seismic energy dissipation. Earthquake Eng Struct Dyn 1995;24(9):1195-213. ↩
Chai YH. Incorporating low-cycle fatigue model into duration-dependent inelastic design spectra. Earthquake Eng Struct Dyn 2005;34(1):83-96. ↩