Xiaowei Wang^{a,b}, Aijun Ye^b, Bohai Ji^{a,*}
^a College of Civil and Transportation Engineering, Hohai University, Nanjing 210024, China
^b State Key Lab of Disaster Reduction in Civil Engineering, Tongji University, Shanghai 200092, China
Abstract
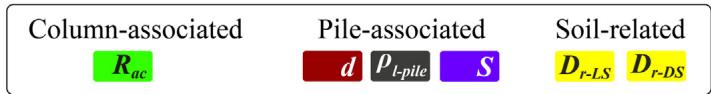
Characterizing the effect of varying model parameters on the seismic performance of bridges is a desirable assistance to retrofits of existing bridges and designs of new bridges, especially for those in complex geotechnical conditions where scour and liquefaction potentials are involved. This paper aims to rank the sensitivity of fourteen structural and soil parameters for seismic performance assessment of pile-group-supported bridges in liquefiable ground undergoing scour potentials. To this end, a fragility-based Tornado diagram method for sensitivity analyses is proposed first in this study. An experimentally validated soil-foundation-bridge coupled finite element model considering scour and liquefaction effects is adopted and excited by a set of real ground motions for fragility analyses. Results indicate that the effect of scour depth slightly influence the most sensitive parameters, mainly including column height and diameter and pile diameter, for the performance of bridge components (i.e., bearing, column and pile). However, the increase of scour depth does downgrade the relative sensitivity of column-associated ones (e.g., column height and axial compressive ratio) and soil-related ones (i.e., loose and dense sand relative densities), while upgrade that of the pile-associated ones (e.g., pile diameter, center-to-center distance and longitudinal reinforcement ratio). In addition, to abide the capacity design principle that columns should fail before pile foundations, designs or retrofits of bridges using relatively larger pile diameter, column height, material strengths and longitudinal/transverse reinforcement ratios, together with smaller column diameter and pile center-to-center distance are recommended for mitigating scour and liquefaction effects on the seismic performance of pile foundations.
Keywords: Bridge; Sensitivity; Seismic fragility; Scour; Liquefaction; Tornado diagram
1 Introduction
Scour has been reported as one of the most severe hazards causing bridge failures 1,2. Fig. 1 shows an example of typical multi-span bridges subjected to the scour hazard, in which pile foundations were exposed without confinement of surrounding soils, leading to the degradation of lateral capacity of the bridges. On the other hand, saturated soils, especially cohesionless ones, in scoured bridge sites probably liquefy under following earthquakes. Liquefaction-induced damage to pile foundations and associated bridge failures have been reported in many earthquake events 3,4. Previous studies on the seismic behavior of bridges, regardless of field and laboratory experiments (e.g., 5,6,7,8,9) or numerical analyses (e.g., 10,11,12,13,14), often considered the effect of liquefaction or scour, separately. However, it tends to be common in practice that bridges are located in flood-induced scour sites where saturated sands may liquefy under earthquakes. In this regard, Wang et al. 15 recently reported the first shake-table test on scoured pile-group-supported bridges in liquefiable soils. Moreover, scour can affect wave propagations in soils 16, thereby affecting liquefaction potentials as well as the seismic behavior of bridges. Hence, predictions of the seismic performance of bridges in complex geotechnical conditions such as scour and liquefaction require special attention.
Numerical predictions on the seismic performance of soil-bridge systems may be susceptible to varying model parameters. From a predictive point of view, it is desirable to characterize impacts of these parameters to assist in seismic retrofits and designs of bridges. For this purpose, previous studies have identified key parameters and their variations in response prediction and performance assessment of bridges in non-scoured and non-liquefiable ground 17,18,19 as well as in scour or liquefiable ground, separately 20,21,22. To the best knowledge of the authors, critical parameters for seismic performance of bridges under combined effects of scour and liquefaction hazards have not been documented well. Furthermore, impacts of scour depths and structural damage limit states on sensitivity rankings of these parameters have never been reported. These gaps stimulate the motivation for the present study.

2 Methodology
There are several methods for sensitivity analyses in civil engineering, primarily including Tornado diagram, First-Order-Second-Moment and Monte Carlo simulation. Among them, the Monte Carlo simulation often requires heavy computational efforts, especially for nonlinear dynamic analyses that involve complex soil-foundation-structure interactions. The application range of First-Order-Second-Moment method falls into circumstances where demands exhibit a linear trend (or slightly nonlinear) across the varied parameters. Such circumstances are often difficult to meet for bridges in liquefiable soils, as high levels of nonlinearities are often involved. By contrast, Tornado diagram, which is adopted in this study, is an efficient solution from a view of practice. Moreover, this study concentrates on the seismic performance assessment (i.e., considering both the demand and capacity), rather than the seismic demand assessment merely. Hence, fragility analyses are used to rigorously estimate the seismic performance of bridges. In addition, fragility analyses can efficiently assess the performance at multiple damage limit states. Considering these merits, a fragility-based Tornado diagram method is proposed in this study for sensitivity analyses. Fig. 2 illustrates the process of this method described as below.
For a parameter supposing a normal or lognormal distribution, two extreme values at 16th and 84th percentiles (i.e. mean, \mu, minus and plus standard deviation, \sigma) are adopted as lower and upper bounds, respectively. A set of real ground motions is selected for dynamic analyses of three FE models that adopt parameters with the lower, mean and upper values, respectively. Probabilistic seismic demand analyses using Cloud method 23 are performed to build the corresponding three probabilistic seismic demand models (PSDMs), which represent probabilistic relationships between engineering demand parameters (EDPs) and intensity measures (IMs). According to the mathematical basis of fragility curves 23 and the pre-defined probabilistic capacity models, three fragility curves that reflect the impact of this parameter on the seismic performance are generated using Eq. (1):
where \Phi(\cdot) is the standard normal cumulative distribution function, D is the demand, C is the capacity, S_D and S_C are median values of the demand and capacity, respectively, \beta_D and \beta_C are logarithmic standard deviations of the demand and capacity, respectively. Based on the fragility curves, IM values at a given level of probability of exceedance, P_r (e.g., 50\%, the so-called median fragility values, as used in this study) are obtained as the "performance indices" (i.e., IM_{\mu-\sigma}, IM_{\mu} and IM_{\mu+\sigma}) for this parameter in Tornado diagram. The obtained performance indices are sorted from high to low based on their ranges, R_{IM}, as defined in Eq. (2), to fulfill the Tornado diagram:
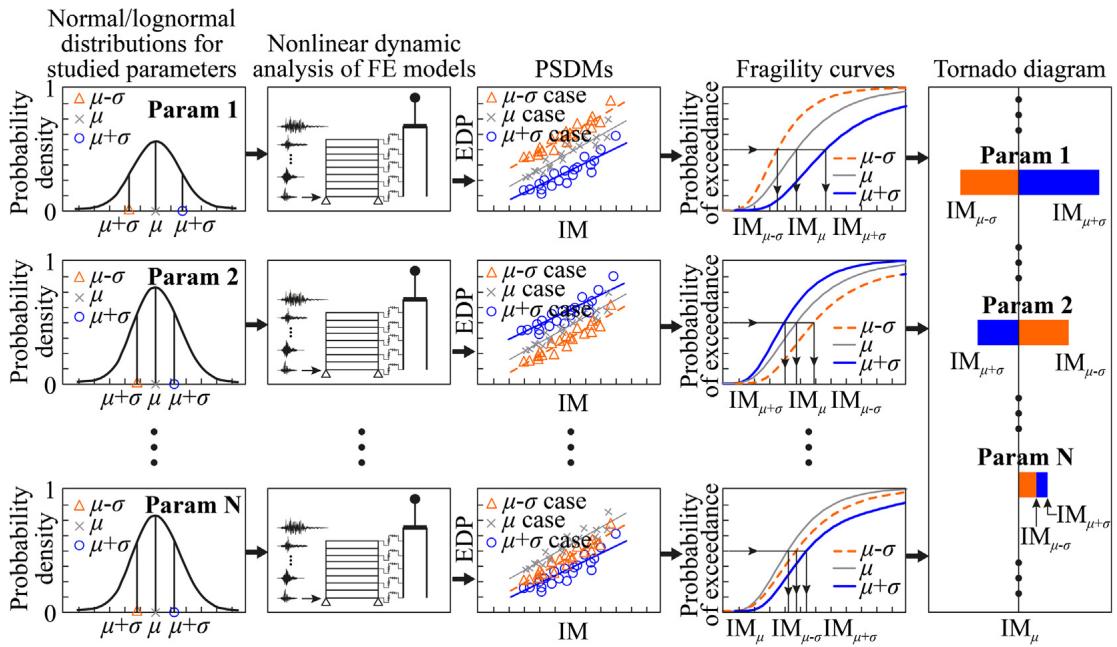
Fig. 2. Illustration of the fragility-based Tornado diagram for sensitivity analysis
3 Numerical modelling and validation
3.1. Description of centrifuge test
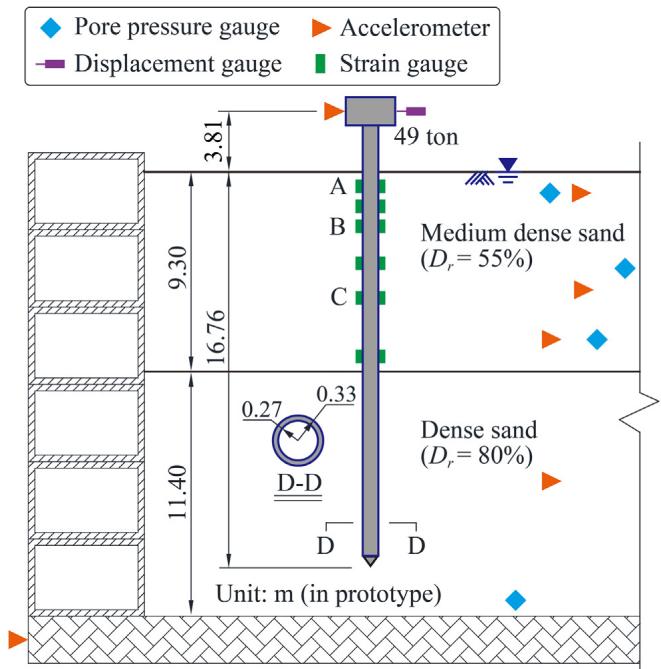
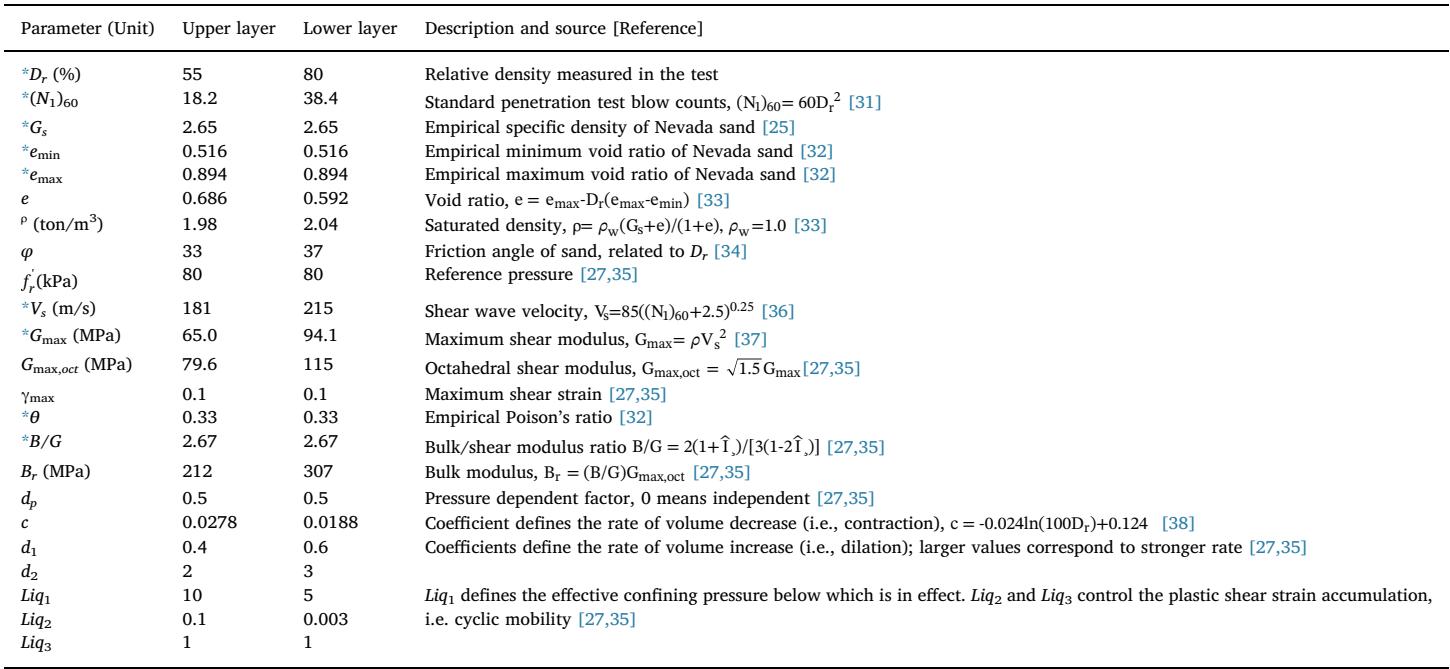
To validate the numerical modelling technique adopted in this study, a centrifuge test named CSP3 and performed by Wilson 24, which investigated the behavior of pile-supported structures in liquefied soils, is simulated. Fig. 3 shows the test setup, in which a 0.67\text{m} diameter/0.06\text{m}-thickness steel-pipe pile with a lumped mass of 49\text{ton} is embedded 16.76\text{m} into saturated medium dense Nevada sand with a relative density, D_r = 55\% overlying dense Nevada sand (D_r = 80\%).
3.2. Finite element modelling
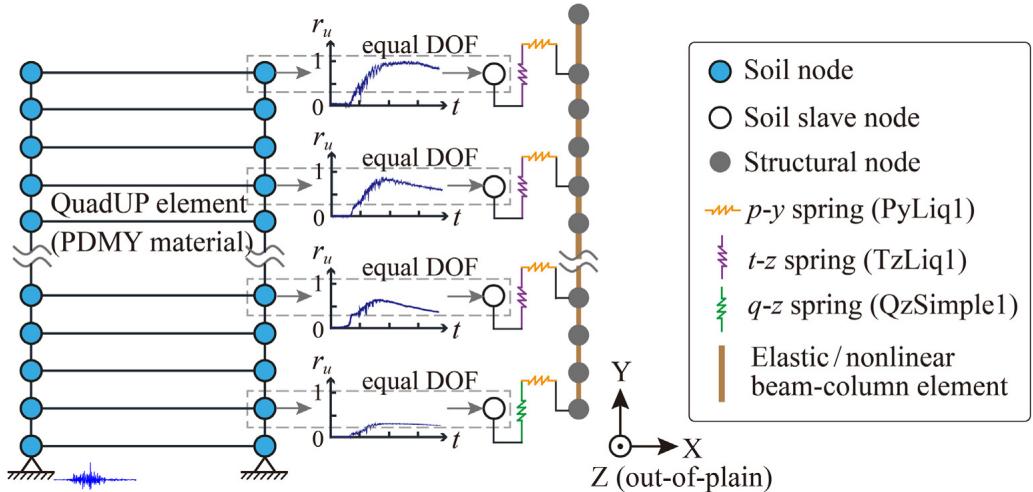
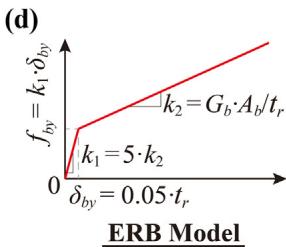
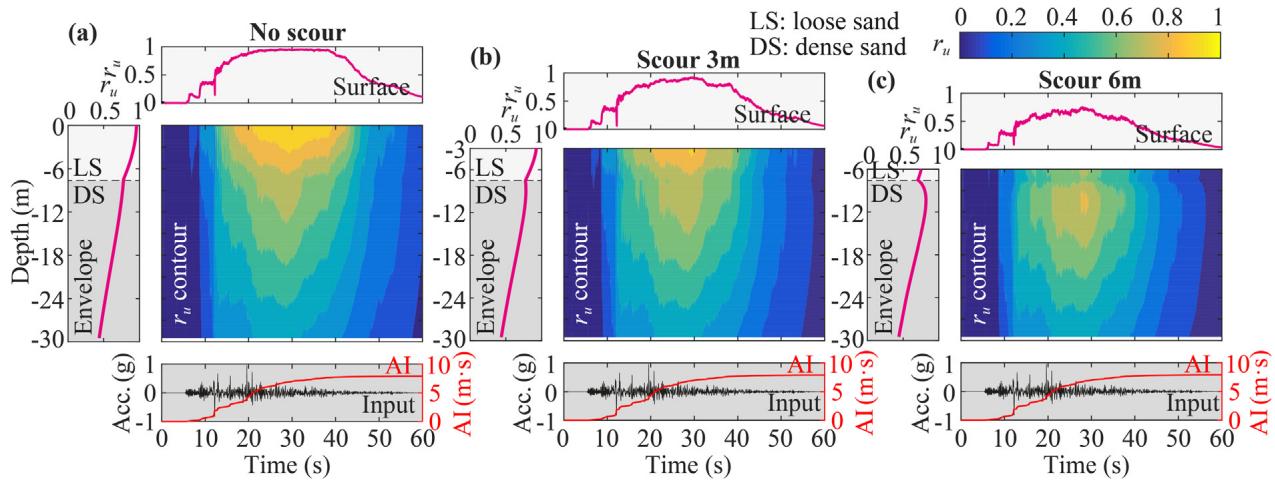
To model the centrifuge test 24, a coupled multidimensional soil-pile-structure FE model is built in OpenSees 25. Fig. 5 schematically illustrates the FE model. Two-dimensional plain-strain soil columns are linked to three-dimensional piles through one-dimensional soil-pile springs. Pressure-dependent multi-yield (PDMY) materials are assigned to four-node QuadUP shear-beam elements to simulate liquefaction under cyclic excitations 26. Soil-pile springs are modeled using the PyLiq1 and TzLiq1 materials for the lateral resistance (p\text{-}y spring) and vertical friction (t\text{-}z spring), respectively, and the QzSimple1 material for the vertical resistance at pile tip (q\text{-}z spring) 27. Soil liquefaction can be represented by the excess pore pressure ratio, r_u = \Delta u/\sigma_{v0}', where \Delta u is the recorded variation of pore pressure, and \sigma_{v0}' is the initial effective overburden stress.
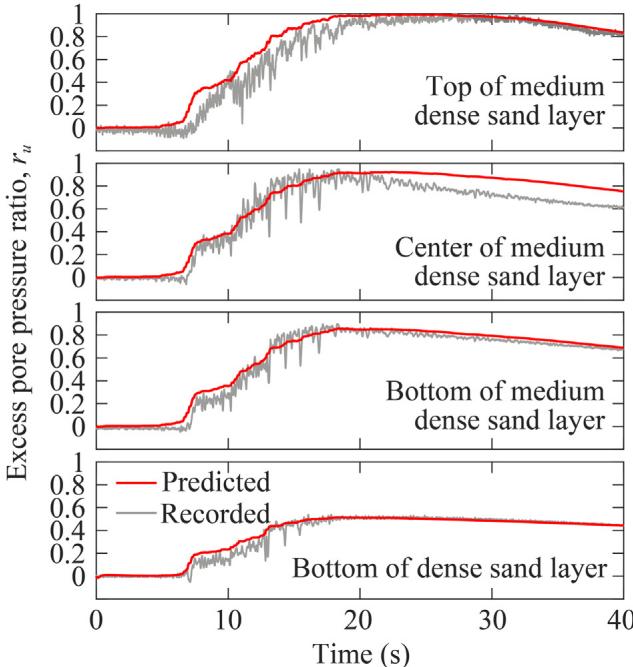
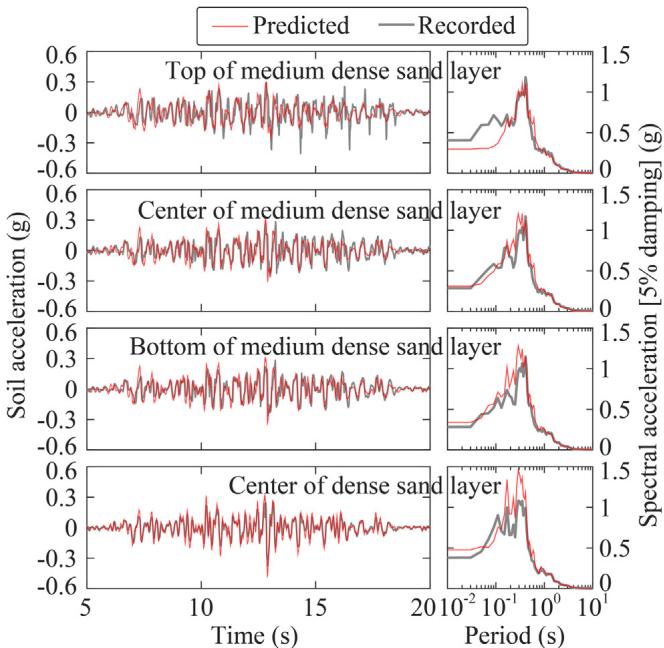
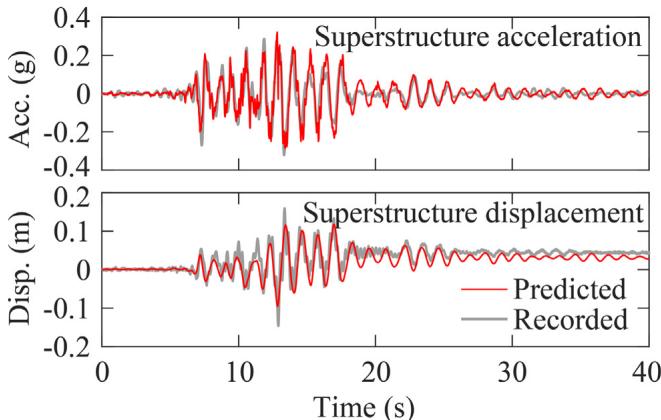
3.3. Model validation: Numerical predictions versus test records
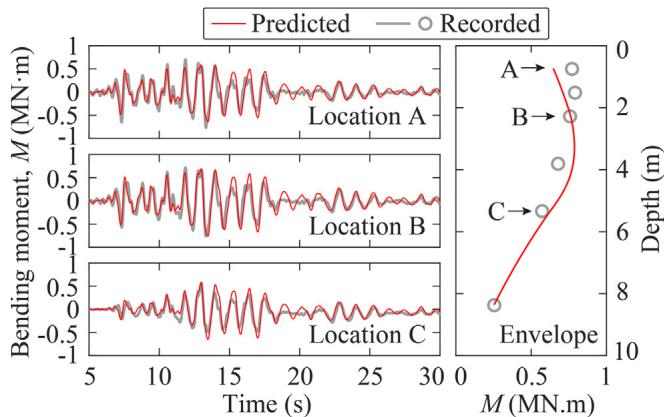
The numerical model is validated by comparisons between recorded and predicted results in terms of pore pressure ratio developments (Fig. 6), soil acceleration responses (Fig. 7), superstructure acceleration and displacement responses (Fig. 8), and pile bending moment responses (Fig. 9). Error of the peak responses are generally within 20\% (most within 10\%).
4 Studied soil-bridge system, parameters and ground motions
4.1. Scope of studied soil-bridge system and FE modelling
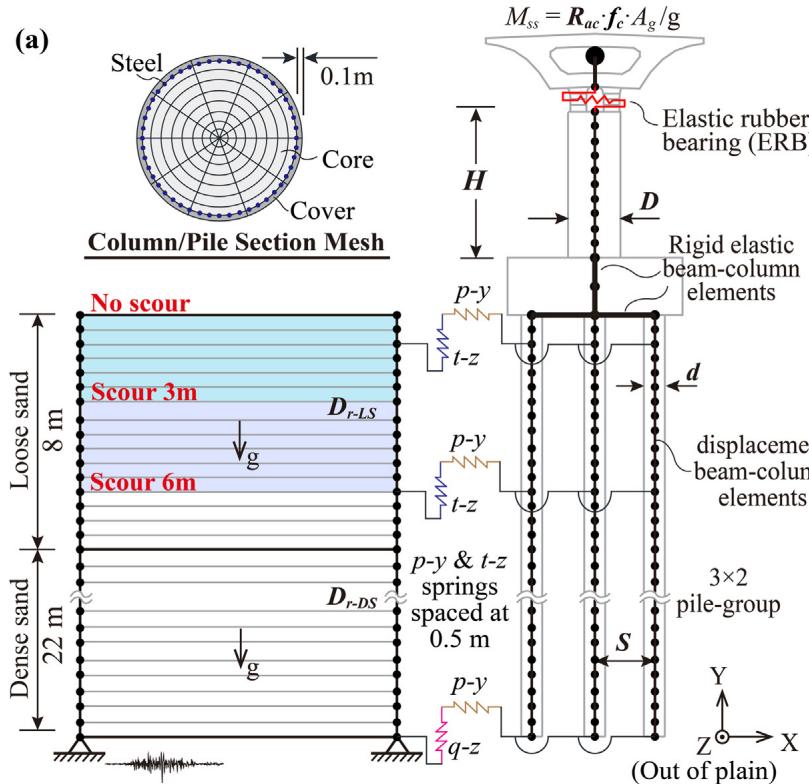
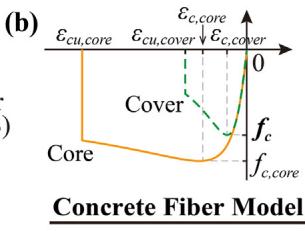
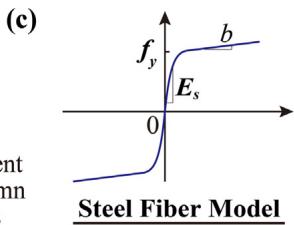
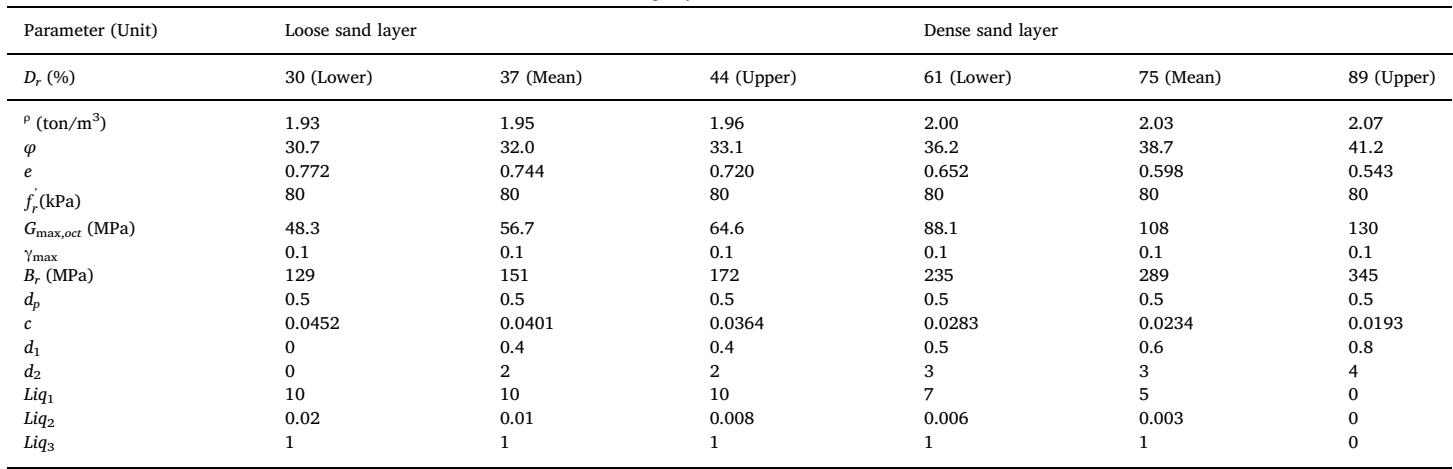
The scope of the studied soil-bridge system falls into regular multi-span RC girder bridges with multiple bents, each supported by a pile-group foundation subjected to scour and liquefaction potentials. This study focuses on the transverse direction. Fig. 10 schematically shows the multi-dimensional modelling of the studied soil-bridge system in OpenSees 25. A 3 \times 2 pile-group-supported single column with a lumped mass is embedded into a two-layered soil profile. Scenarios include no scour, scour 3\text{m}, and scour 6\text{m}. Piles and the single column are modeled using displacement-based beam-column elements (0.5\text{m} length, five integration points). The concrete fiber model uses Concrete04 28 (\epsilon_{c,\text{cover}} = 0.002, \epsilon_{cu,\text{cover}} = 0.005). The steel fiber model uses Steel02 29 (b=0.01). Lumped mass M_{ss} is determined by M_{ss} = R_{ac} f_c A_g / g.
4.2. Studied parameters for sensitivity analyses
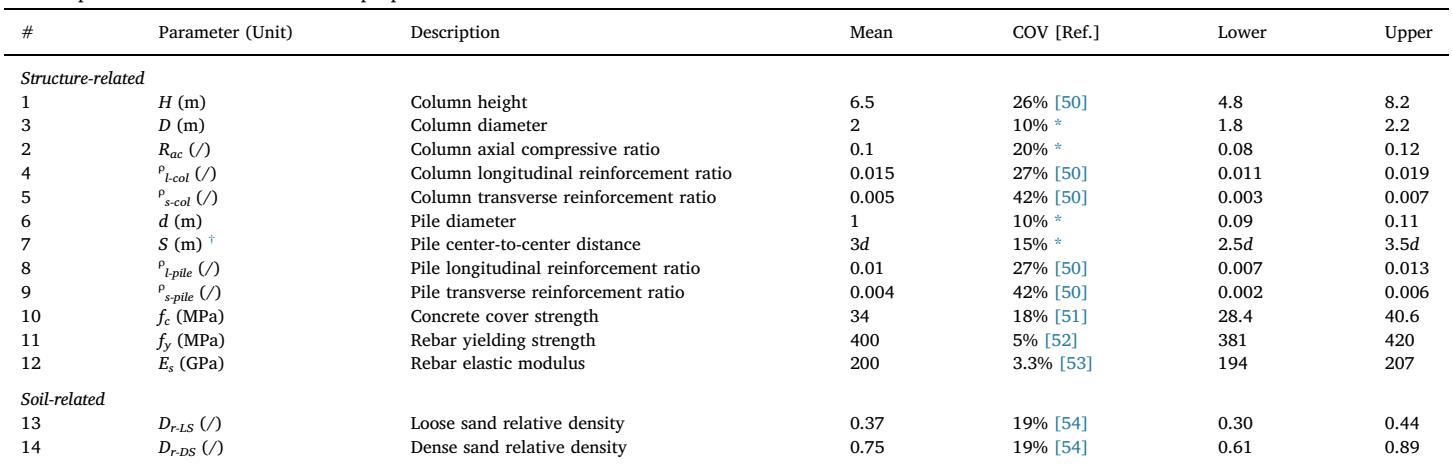
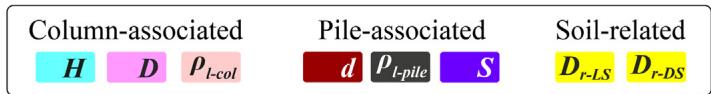
Table 2 lists the fourteen parameters for sensitivity analyses, including geometric configurations (H, D, d and S), reinforcement ratios (\rho_{l\text{-col}}, \rho_{s\text{-col}}, \rho_{l\text{-pile}} and \rho_{s\text{-pile}}), and material strengths (f_c, f_y and E_s). There are 1 (\text{mean}) + 14 \times 2 (\text{bounds}) = 29 cases for each scour scenario, totaling 87 cases.
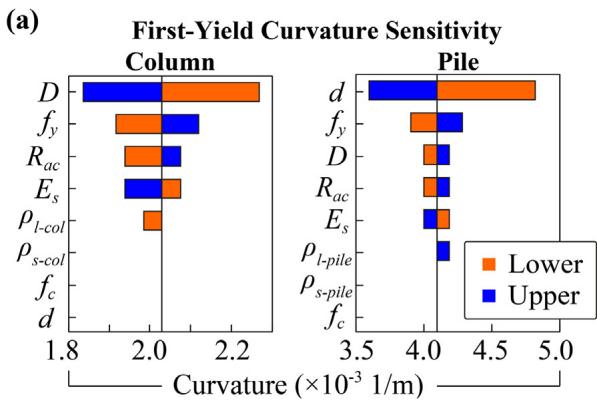
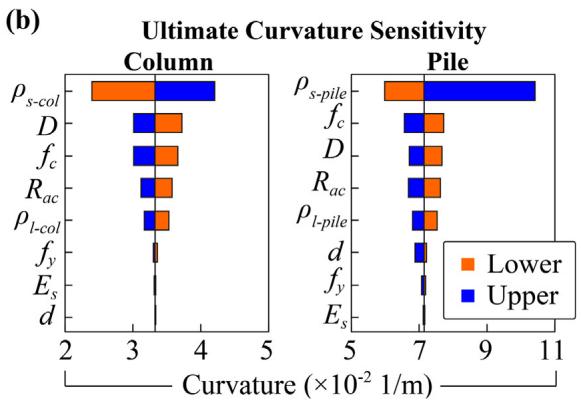
4.3. Considered EDPs and sensitivity of section limit states
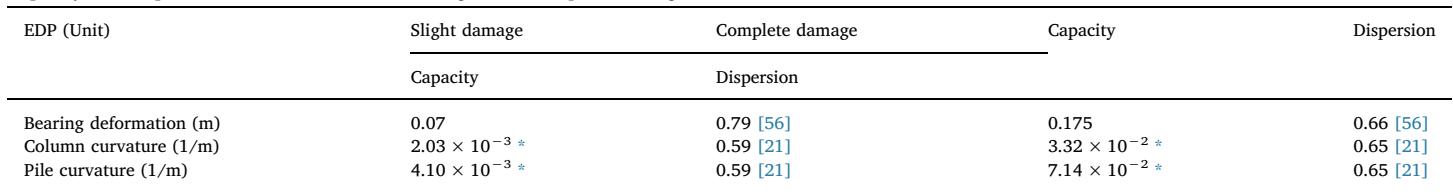
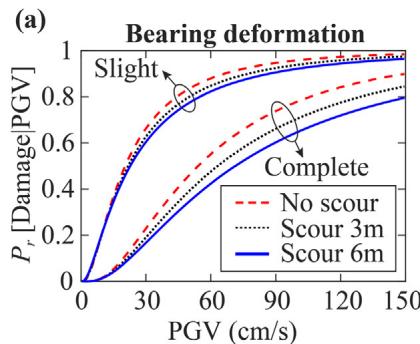
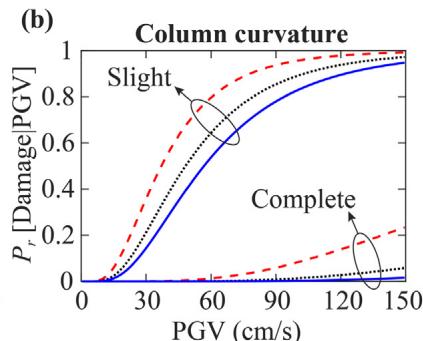
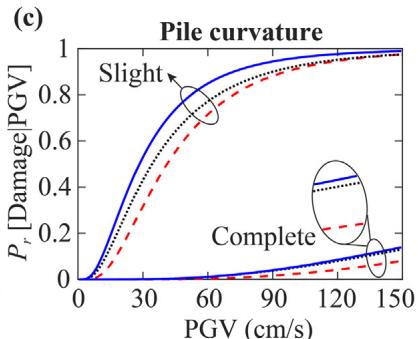
Three EDPs are considered: bearing deformation, peak column curvature, and peak pile curvature. Two damage limit states, slight and complete, are assessed (Table 4). Bearing deformation refers to 100\% and 250\% shear strain for slight and complete states. Curvature limit states are obtained from section moment-curvature analyses. Fig. 11 shows the relative sensitivity of section-relevant parameters on curvatures. For first-yield curvature, diameters (D and d) are most sensitive. For ultimate curvature, \rho_{s\text{-col}} and \rho_{s\text{-pile}} are most sensitive.
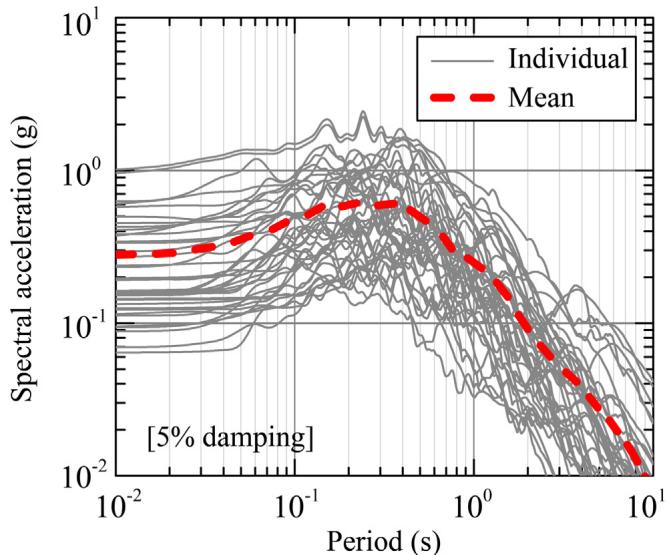
4.4. Adopted ground motions40 non-pulse-like real ground motions for rock sites 32 are adopted for each case. A total of 40 \times 87 = 3480 dynamic analyses are run. Fig. 12 shows acceleration spectra.
5 Characteristic results of the dynamic analyses
5.1. Typical seismic responses
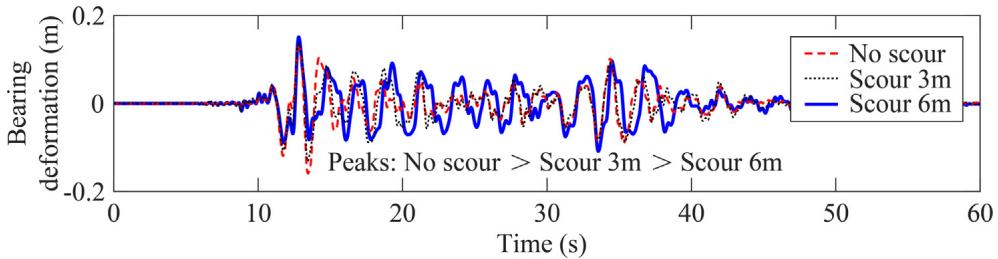
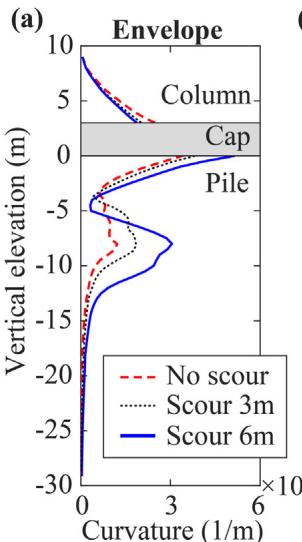
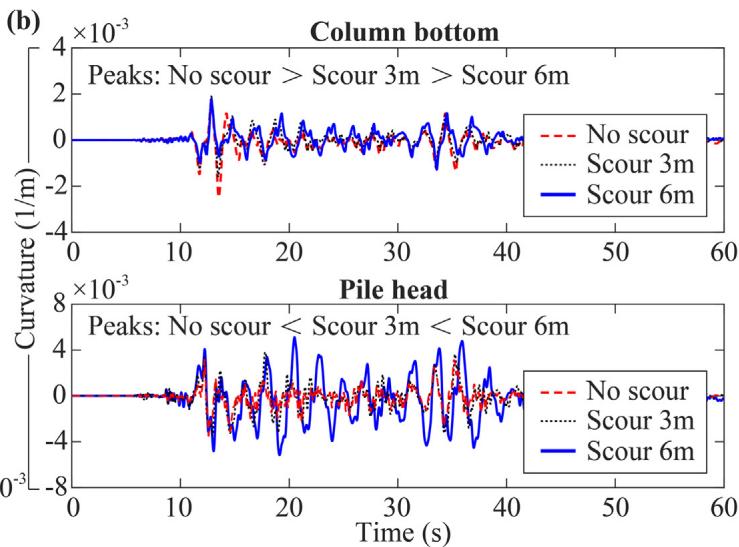
Increasing the scour depth reduces both the duration and extent of liquefaction (Fig. 13). Fig. 14 presents bearing deformation responses; the "no scour" scenario shows the largest peak response due to the isolation effect of scour. Fig. 15 shows that column curvature decreases with increasing scour depth, while pile curvature increases. Scour can transfer failure modes from the bearing and column bottom to the pile head, which contradicts the capacity design principle.
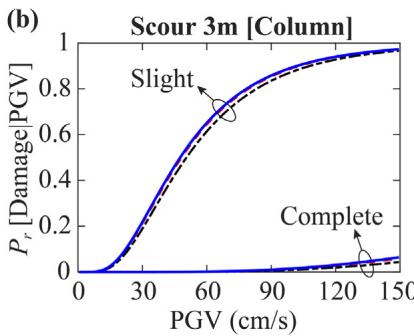
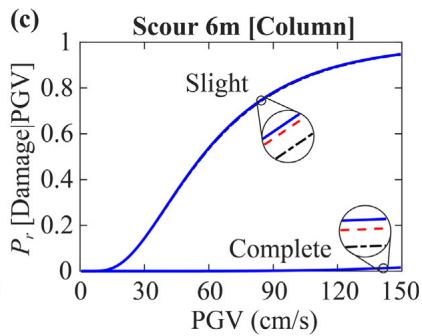
5.2. Fragility curve examples
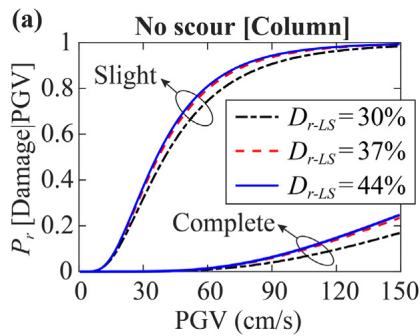
Peak ground velocity (PGV) is adopted for fragility analyses. Fig. 16 shows that larger scour depth leads to lower damage probability for bearing and column (beneficial base isolation), but higher damage probability for the pile foundation (detrimental flexibility increment). Figs. 17 and 18 show that densifying the loose sand layer (D_{r\text{-LS}}) improves pile performance but increases column damage probability by providing a stiffer boundary.
6 Sensitivity analyses results
6.1. Effects of scour depths on sensitivity rankings
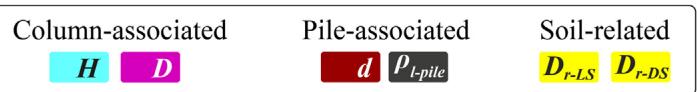
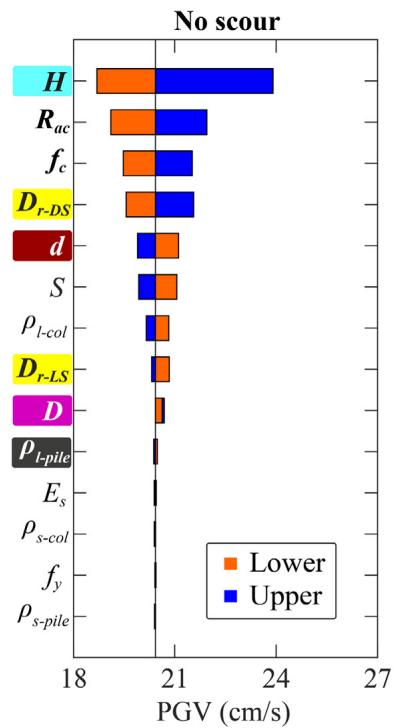
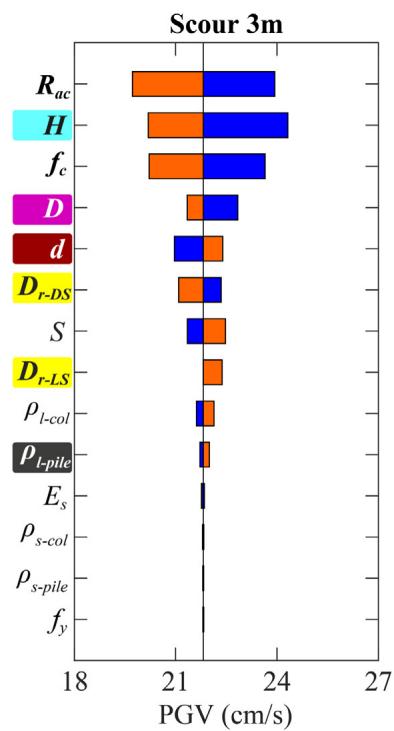
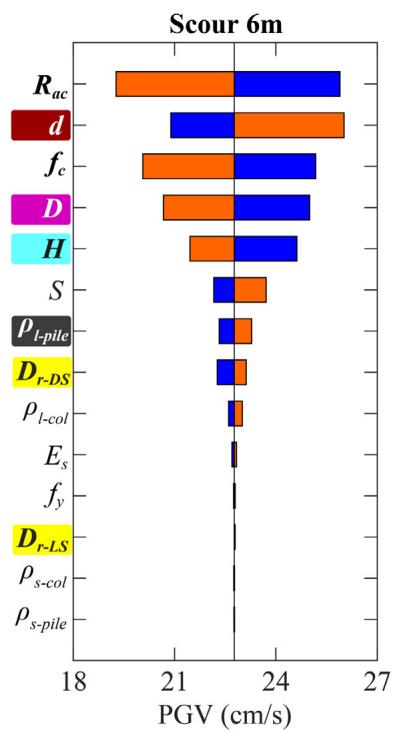
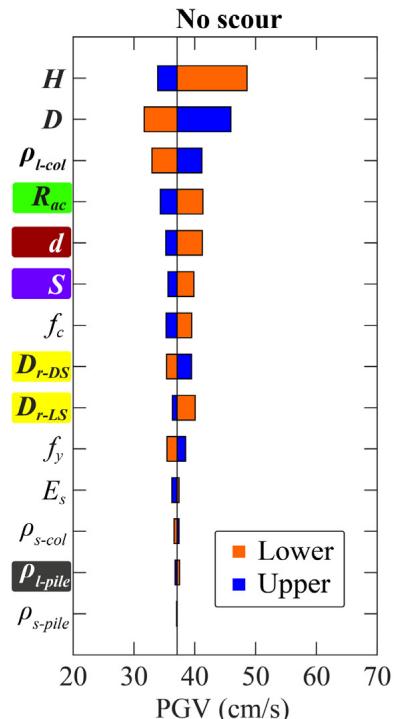
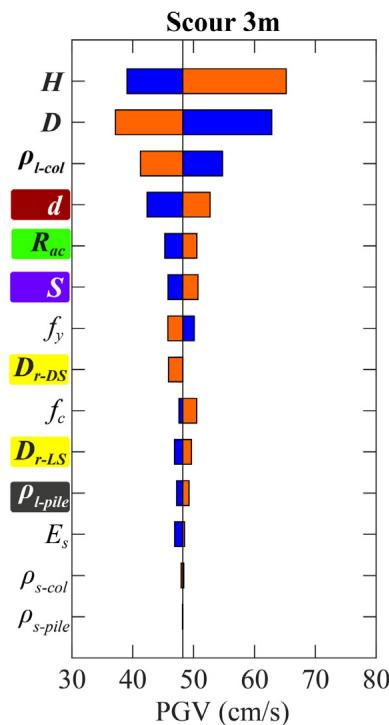
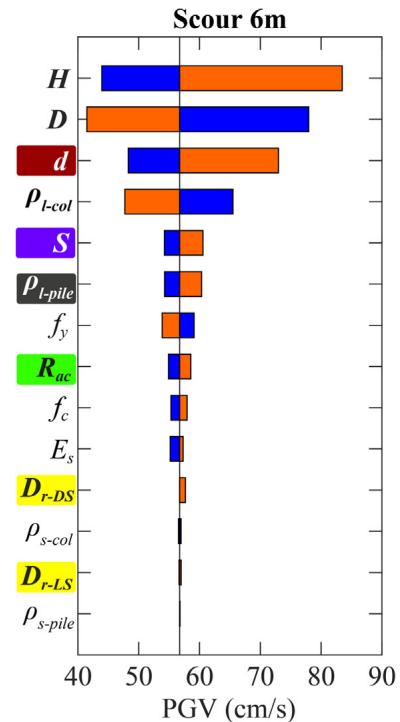
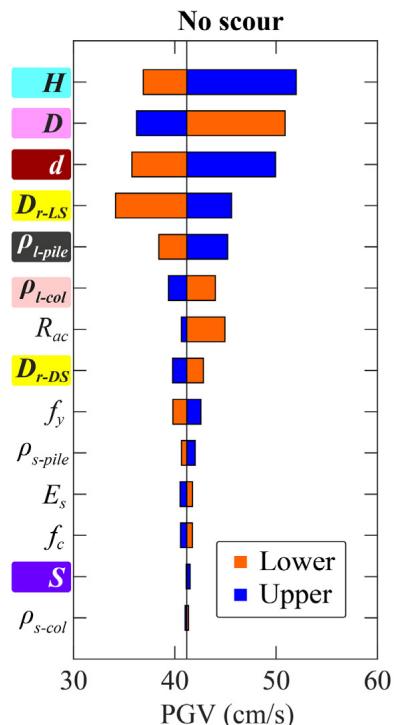
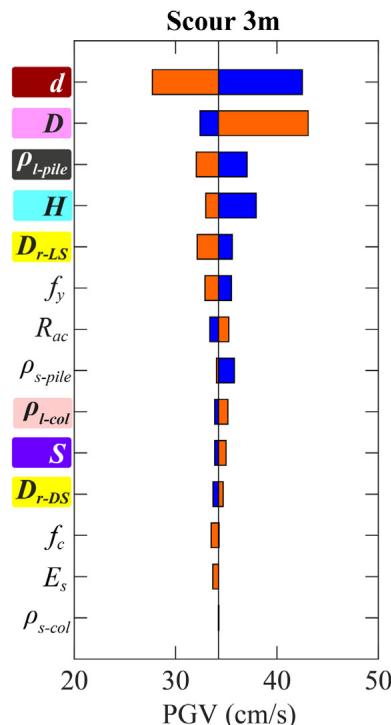
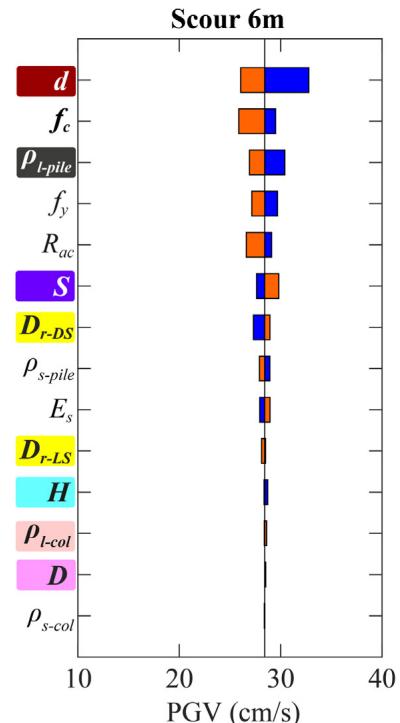
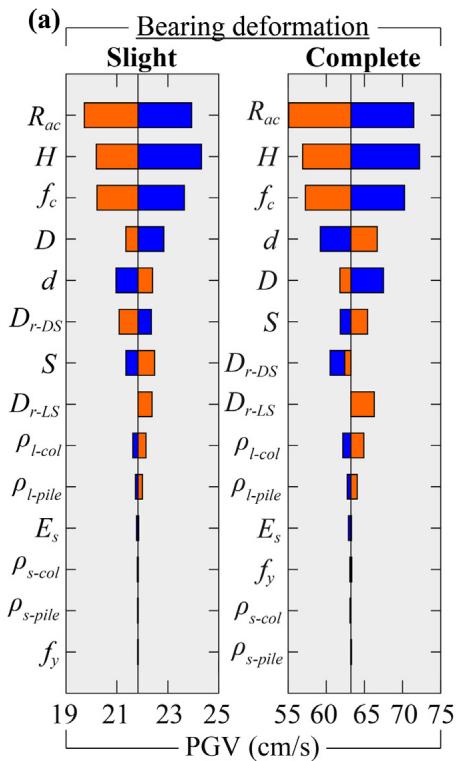
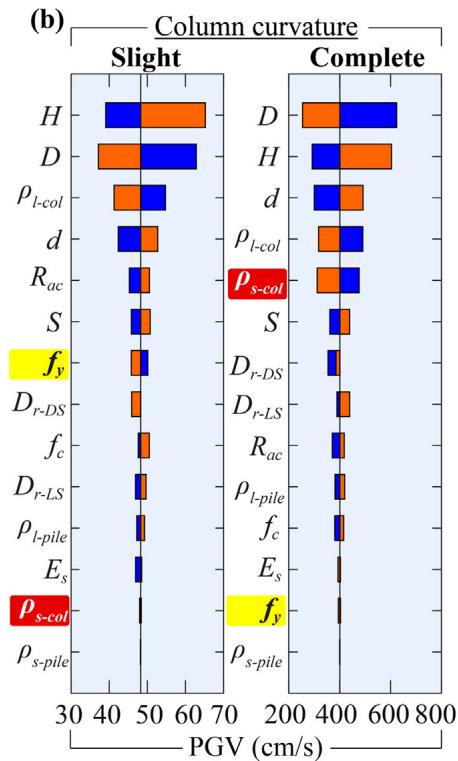
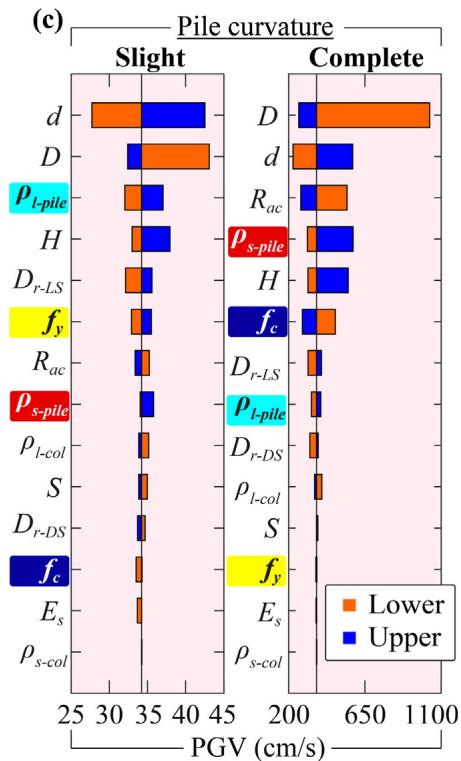
Absolute sensitivity is higher for fragility curves with lower damage probabilities. For bearing (Fig. 19), R_{ac} and f_c are the most sensitive. For column (Fig. 20), H, D and \rho_{l\text{-col}} are most sensitive. For pile (Fig. 21), diameter d is generally the most sensitive. Increasing scour depth downgrades the relative sensitivity of column-associated and soil-related parameters while upgrading pile-associated ones.
6.2. Effects of damage limit states
Absolute sensitivity for complete damage states is much higher than for slight damage states (Fig. 22). For column and pile, the relative sensitivity of transverse reinforcement ratios upgrades dramatically for the complete damage state, while steel yielding strength downgrades.
6.3. Preliminary recommendations
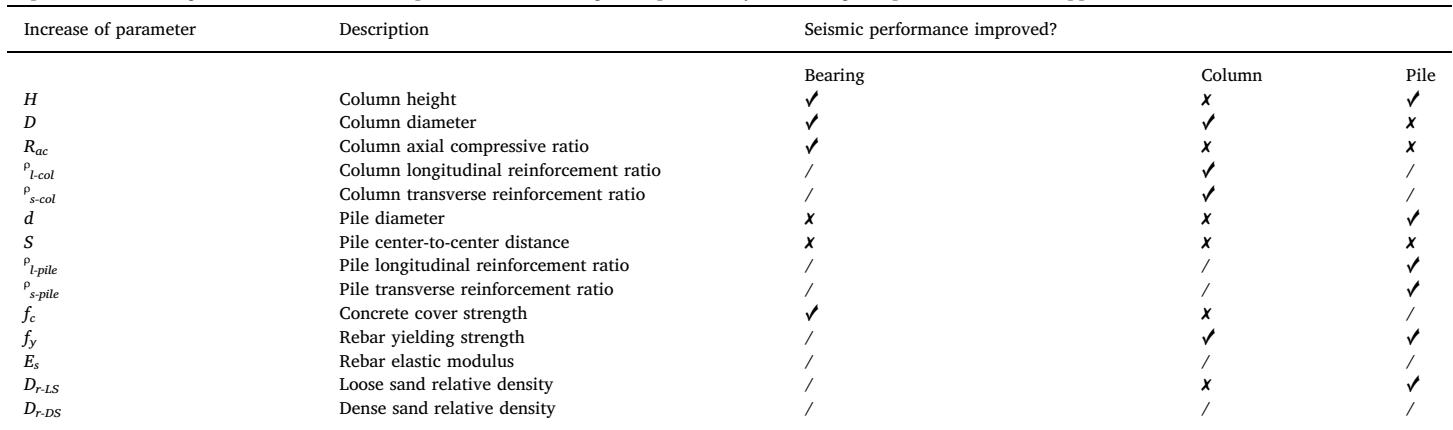
Based on Table 5, larger pile diameter (d), column height (H), reinforcement ratios (\rho), and material strengths (f_c, f_y), along with smaller column diameter (D) and pile spacing (S), are recommended to mitigate scour and liquefaction effects on pile foundations.
7 Conclusions
- R_{ac}, H and f_c are most sensitive for bearing; H, D and \rho_{l\text{-col}} for column; d for pile.
- Scour downgrades the relative sensitivity of column and soil parameters while upgrading pile parameters.
- Complete damage states upgrade the sensitivity of transverse reinforcement and concrete strength while downgrading longitudinal reinforcement and steel yielding strength.
- Steel elastic modulus is generally an insensitive parameter.
- Capacity design recommends using larger pile diameters and reinforcement ratios to protect foundations under combined hazards.
References
Deng L, Wang W, Yu Y. J Perform Constr Facil 2016;30(2):04015005. ↩
Wardhana K, Hadipriono FC. J Perform Constr Facil 2003;17(3):144-50. ↩
Cubrinovski M, et al. Earthq Spectra 2014;30(1):57-83. ↩
Buckle I, et al. Earthq Spectra 2012;28(Suppl. 1):533-52. ↩
Brandenberg SJ, et al. J Geotech Geoenvviron Eng 2005;131(11):1378-91. ↩
Liu X, et al. Acta Geotech 2018;13(6):1405-18. ↩
Wang S, et al. Earthq Eng Struct Dyn 2015;44(6):849-64. ↩
Wang X, et al. J Bridg Eng 2016;21(2):04015042. ↩
Liu Y-T, et al. Fourth Int. Conf. Genet. Evol. Comput. 2010. p. 501-4. ↩
Cheng Z, Jeremić B. Soil Dyn Earthq Eng 2009;29(11-12):1405-16. ↩
Wang X, et al. Int J Geomech 2017;17(6):06016039. ↩
Blanco G, et al. J Bridg Eng 2019;24(1):04018104. ↩
Klinga JV, Alipour A. Eng Struct 2015;82:55-71. ↩
Aygün B, et al. J Bridg Eng 2011;16(1):93-107. ↩
Wang X, et al. Earthq Eng Struct Dyn 2019:1-21. ↩
Shang Y, et al. J Struct Eng 2018;144(8):04018099. ↩
Padgett JE, DesRoches R. J Struct Eng 2007;133(12):1710-8. ↩
Choe D-E, et al. J Eng Mech 2007;133(7):833-43. ↩
Kwon O-S, Elnashai A. Eng Struct 2006;28(2):289-303. ↩
Brandenberg SJ, et al. Geotech. Earthq. Eng. Soil Dyn. IV 2008. ↩
Padgett JE, et al. Struct Infrastruct Eng 2010;9(1):59-77. ↩
Wang X, Ye A, Luo F. Gongcheng Lixue/Eng Mech 2016;33(8):132-40. ↩
Wilson DW. Soil-pile-superstructure interaction in liquefying sand [Ph.D. thesis] 1998. ↩ ↩
Yang Z. Numerical modeling of earthquake site response including dilation and liquefaction [Ph.D. thesis] 2000. ↩
Boulanger RW, et al. Pile foundations in liquefied and laterally spreading ground 2003. ↩
Mander JB, et al. J Struct Eng 1988;114(8):1804-26. ↩
Filippou FC, et al. Report No. EERC 83-19 1983. ↩
Zhang J, Huo Y. Eng Struct 2009;31(8):1648-60.
AASHTO. AASHTO LRFD bridge design specifications 2012.
Baker JW, et al. PEER Transportation Research Program 2011. ↩
Kayen RE, Mitchell JK. J Geotech Geoenvviron Eng 1997;123(12):1162-74.