Girder-to-Girder and Abutment Chain Pounding and Collapse Mechanisms in Multi-Frame Highway Bridges: Lessons From the 2021 Magnitude 7.4 Maduo Earthquake
Cheng Zhou¹ | Xiaowei Wang¹² | Shaolun Bao³ | Aijun Ye¹² ✉
¹ Department of Bridge Engineering, College of Civil Engineering, Tongji University, Shanghai, China ² State Key Laboratory of Disaster Reduction in Civil Engineering, Tongji University, Shanghai, China ³ CCCC First Highway Consultants Co. Ltd, Xi'an, Shaanxi Province, China
Correspondence: Aijun Ye (yeaijun@tongji.edu.cn)
Received: 17 September 2025 · Revised: 30 December 2025 · Accepted: 2 January 2026
Keywords: chain pounding · collapse mechanism · girder-to-abutment pounding · Maduo earthquake · multi-frame bridge · near-fault ground motions
Journal: Earthquake Engineering & Structural Dynamics, 2026.
ABSTRACT
Two neighboring highway girder bridges exhibited significantly different damage during the 2021 Magnitude 7.4 Maduo earthquake. Yematan Bridge, a multi-frame girder bridge (five frames each with five spans, denoted as 5 \times 5 spans), suffered collapse of 7 0 \% of the total number of girders (mostly on the north side), expansion joint damage from girder-to-girder pounding, and severe north abutment damage due to girder-to-abutment pounding, whereas the single-frame Heihe Middle Bridge with three spans (\mathrm {1} \times 3 spans)remained almost intact. This contrast highlights the crucial roles of frame/span numbers and girder-to-girder/abutment pounding in bridge performance. In this regard, a comprehensive parametric analysis using finite element full bridge models is conducted to reproduce the observed damage and to explore pounding and collapse mechanisms, considering the effects of near-fault pulse-like ground motions (i.e., pulse period, velocity, and wave passage) as well as the frame/span numbers. A novel pounding Gantt plot is proposed to visualize the successive pounding events from girder-to-girder to girder-to-abutment, called chain pounding in this study. Results show that significant chain pounding occurs in Yematan Bridge under specific long-period pulse-like motions with wave-passage effect, which is the primary cause of the severe north abutment damage and girder collapses. In contrast, such a devastating chain pounding is absent in the single-frame Heihe Middle Bridge, where stronger abutment constraint effects on girders shift its vibration period away from unfavorable pulse periods of ground motions, thereby mitigating damage. Furthermore, decreasing the frame/span numbers reduces bearing displacements under long-period pulse-like ground motions, but increases them under short-period motions. Thus, seismic design of multi-frame and multi-span highway bridges at near-fault sites should carefully consider relationships between bridge length and pulse period of ground motions.
1 Introduction
On May 22, 2021, a magnitude 7.4 earthquake struck Maduo County, Qinghai Province, China (hereafter referred to as the 2021 M7.4 Maduo earthquake), causing significant damage to several bridges. One of the most affected structures was Yematan Bridge, a 25-span highway bridge consisting of five frames, each with five spans of simply supported girders connected through a continuous concrete deck (denoted as frame number \times span number in each frame, i.e., 5 \times 5 spans). This bridge experienced severe damage, including collapse of 7 0 \% of the total number of girders (mostly on the north side), expansion joint damage from girder-to-girder pounding, and northern seat-type abutment failures due to girder-to-abutment pounding. In contrast, Heihe Middle Bridge, a similar 1 \times 3 -span single-frame bridge located just 800 meters to the south, remained largely intact. This stark difference highlights the critical roles of bridge length (i.e., numbers of frames and spans), girder-to-abutment and girder-to-girder pounding in characterizing seismic responses and collapse mechanisms. Similar unseating or collapse damage phenomena, as in Yematan Bridge, were also observed in past significant earthquakes, such as the 1999 Chi-Chi [1], 2008 Wenchuan [2], 2010 Maule [3], 2011 Christchurch [4], and 2023 Kahramanmaras earthquakes [5, 6]. In this context, past studies have explored bridge damage mechanisms involving seismic pounding effects [7]. This paper reviews the state of research on three key aspects: girder-to-girder pounding, girder-to-abutment pounding, and the influence of ground motion properties.
In the context of girder-to-girder pounding, theoretical and numerical studies have primarily employed simplified lumped mass models, typically involving one to three single degree-of-freedom (DOF) oscillators, to analyze the relationship between structural parameters (e.g., period, mass, and damping ratio) and pounding behavior as well as seismic responses. For instance, Pantelides and Ma [8] studied the effects of separation distance and inelastic structural behavior on pounding forces and reported that higher damping energy dissipation capacity reduces the pounding forces. Ruangrassamee and Kawashima [9] found that pounding often amplifies relative displacements of girders and thereby leads to unseating. Chau and Wei [10] reported that pounding causes a period shift in structures, that is, the maximum pounding velocity occurs at an excitation period different from the natural period. DesRoches and Muthukumar [11] studied the effects of one-sided pounding and found that pounding has opposite effects on stiff and flexible frames depending on the ratio of the structural period to the characteristic period of the ground motion. For two-sided pounding, they reported that pounding amplifies the response of a stiff frame while suppressing that of a flexible frame. Dimitrakopoulos et al. [12-14]. systematically analyzed one- and two-sided pounding problems for both elastic and inelastic oscillators under pulse excitation, concluding that pounding responses are highly dependent on the period ratio between the structure and the input pulse. In experimental studies, Guo et al. [15]. reported that pounding induces spikes in acceleration. Malhotra et al.[16]. observed that such acceleration spikes travel through the concrete deck with the velocity of a compression wave, according to actual recordings from an instrumented multi-span girder bridge. Other experimental studies have revealed more complex phenomena in pounding, such as uneven contact [17] and contact friction [18, 19], in-plane rotation of the deck due to skewed bridge geometry [20], and others. These studies provide useful simulation techniques and insights on the role of girder-to-girder pounding on deck unseating and even collapse, but generally limited to bridges with a small number of spans such as two or three. For long bridges with multiple frames and spans (e.g., the abovementioned Yematan Bridge with 25 spans in total), studies on mechanisms of potential successive girder-to-girder pounding are yet to be deeply investigated.
The issue of girder-to-abutment pounding has also received much attention in recent years, as abutments often act as critical boundaries in bridges and have been found vital in restricting girder movement [21-23]. Without being exhaustive, it is useful to provide some pertinent examples. Saiidi et al.[24]. found that girder-to-abutment pounding induces large in-plane rotations of the girder. Kun et al.[21].observed that abutments reduce bending moments near pier bases by restricting girder movement, particularly in straight and 3 0 ^ {\circ} -angled skew bridges. Thomaidis et al.[22]. further demonstrated in numerical studies that seat-type abutments help suppress free rocking motion in rocking bridges. Darwash and Mackie [23] reported that increasing abutment stiffness and strength reduces bridge displacements but increases forces on substructures. In contrast, Moayyedi et al.[25]. noted that deck-abutment pounding brings adverse influence on all the bridge components, with the number of spans exacerbating the system fragility. These conflicting findings may arise from various factors that influence girder-abutment pounding, including gap size [26, 27], soil-structure interaction (SSI) [28], ground motion intensity [29], pier rocking [30], and span number [31]. These inconsistencies highlight the need for further investigation into girder-to-abutment pounding, particularly in long bridges with multiple frames and spans.
Pounding-associated bridge damage mechanisms become more complex against special seismic excitations such as spatially varying waves and pulse-like motions. To prevent pounding, DesRoches and Muthukumar [11] recommended a large period ratio between adjacent spans (i.e., exceeding 0.7). However, this recommendation is for uniform excitations, while under spatially varying motions, pounding may occur even if adjacent structures have identical periods [19, 32, 33]. Also, spatially varying motions can significantly increase relative displacements and pounding forces [32, 34, 35]. Additionally, near-fault pulse-like ground motions cause more severe pounding, as pulse-like seismic waves induce considerable displacement demands [25, 33]. However, scarce studies have addressed the combined effects of spatially varying and pulse-like motions on pounding-associated bridge collapse, particularly for long bridges with multiple frames and spans, which enhances the motivation of the present study.
For the examined Yematan Bridge, although a number of studies [36-38] have reported seismic damage properties, most remain largely qualitative descriptions, and analyses of key factors such as girder-to-girder and girder-to-abutment pounding, local abutment damage characteristics, pulse-like ground motions, and wave-passage effects have not been systematically examined. To fill these gaps and complement existing documentation of bridge damage, this study aims to reveal damage mechanisms of Yematan Bridge and Heihe Middle Bridge via an in-depth parametric analysis accounting for girder-to-girder/abutment pounding under varying numbers of spans and frames and different ground motion effects (pulse-like and wave-passage). The paper begins with documentation of on-site bridge damage observations. A full-bridge model is then established that incorporates a macro nonlinear constitutive model of the abutment, as developed in a recent study by the authors [39], to properly account for the nonlinear behavior of abutments and to reduce computational costs of full-bridge dynamic analyses. Subsequently, the parametric analysis is conducted to quantify effects of frame/span number, pulse-like ground motion, and wave passage on bridge collapse. Finally, major findings, design implications, and future studies are addressed.
2 Field Investigation and Documentation of Bridge Damage
Figure 1 displays location information and post-earthquake on-site observations of the two bridges. Yematan Bridge has two separate lanes for uphill and downhill traffic. Each lane is represented by a total 25-span girder bridge, configurated in five frames, each with five spans of simply supported girders connected by a continuous concrete deck (this span configuration is hereafter referred to as ^ {*} 5 \times 5 spans"). Such a simply supported-continuous deck structure has been widely used in China for construction facilitation. Under strong earthquakes, displacement responses of the girders may exceed ultimate limits of bearings, resulting in unseating or even collapse, and the continuous deck may break once the girder falls. In comparison, Heihe Middle Bridge is a 1 \times 3 -span single-frame bridge, but featuring an identical simply supported-continuous deck structure and abutments with respect to the long Yematan Bridge. Basic design information of the two bridges is provided in Appendix A to leave the main body of this paper focusing on the damage observations. From Figure 1A, although both bridges are located about 3 1 ~ \mathrm {k m} from the epicenter, they are very close to the observed surface rupture zone, indicating a near-fault feature. Moreover, the longitudinal axes of both bridges are nearly perpendicular to the surface rupture, implying a directivity pulse-like effect in the longitudinal direction.
Yematan Bridge experienced widespread girder falling and severe abutment failure. All girders moved northward along the bridge longitudinal axis, causing 17 of 25 girders in the uphill lane and 18 of 25 in the downhill lane to collapse, resulting in an overall collapse rate of 7 0 \% . Figure 1B shows that the fallen girders are primarily concentrated on the north side. For all collapsed girders, the north end remained supported on the pier, while the south end fell to the ground. The abutments, particularly the northern ones, suffered significant damage from girder pounding in the longitudinal direction, with backwalls fractured and pushed into the backfill by about 1 . 2 \mathrm {m} . A detailed discussion of abutment damage is provided in a recent study by the authors [39] while the present paper more focuses on pounding and associated collapse. Significant pounding damage also observed at expansion joints between bridge frames [36, 41]. Rubber bearings were sheared off due to excessive girder displacements, forming an isolated seismic system, resulting in minimal damage in the bents. As for the transverse direction, some shear key failures induced by poundings from girders were also observed. Overall, the longitudinal damage was much more severe than the transverse damage. This is a reason why the present study focuses on longitudinal damage.
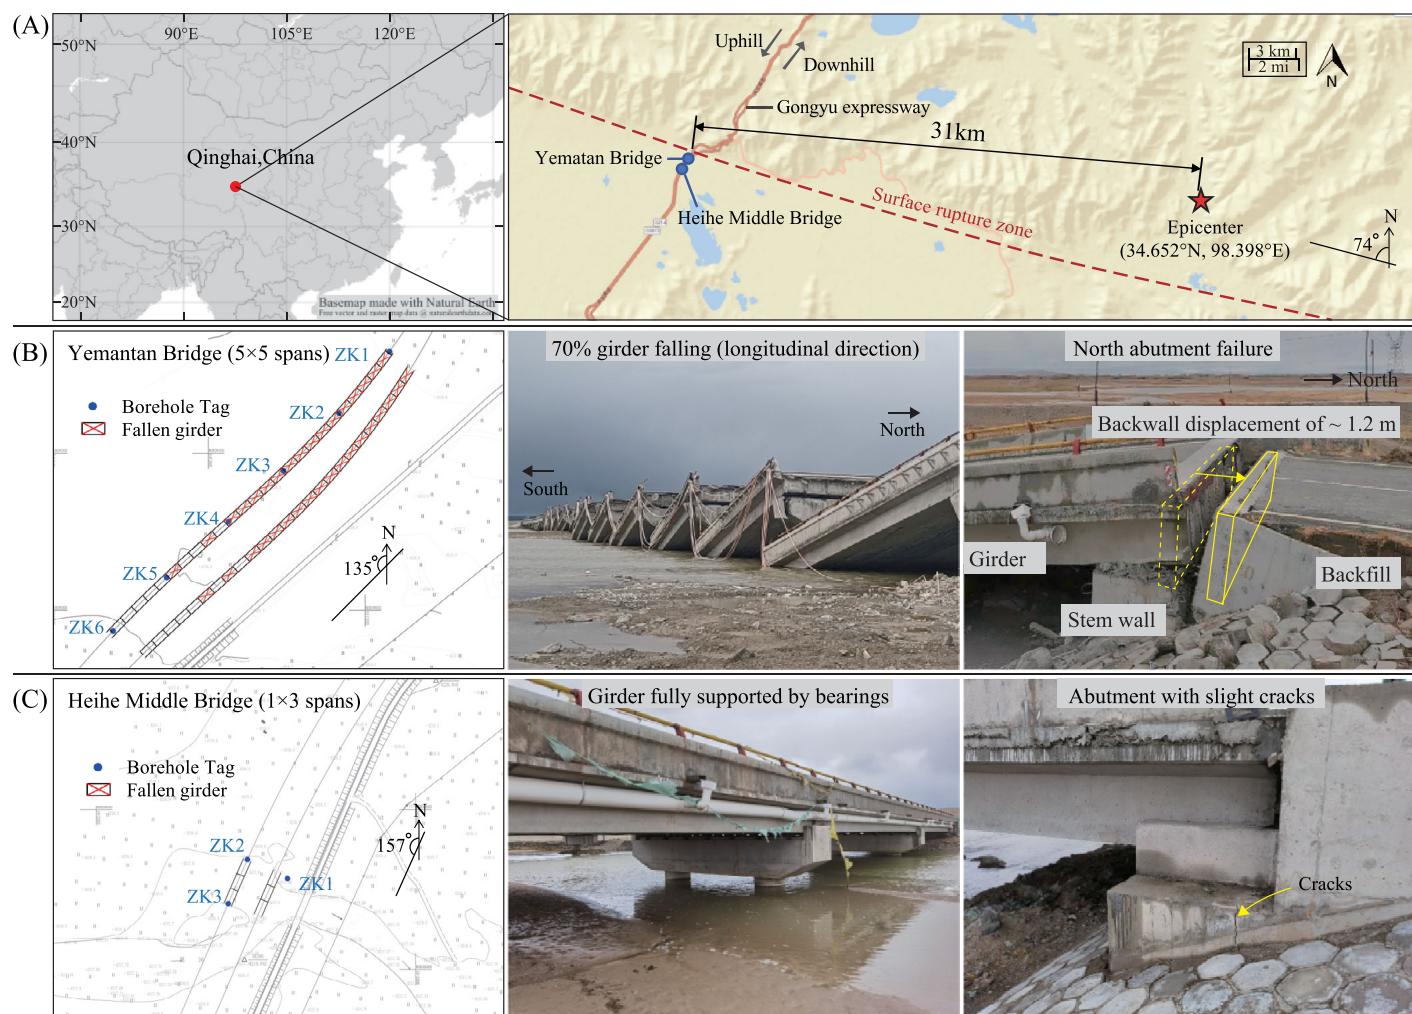
FIGURE 1 | Geographical information and observed damage of two bridges: (A) location of bridges, epicenter [40]; post-earthquake condition of the girders and abutments of (B) Yematan Bridge and (C) Heihe Middle Bridge [Fallen girders (red crosses) and borehole locations (ZK1, ZK2, etc.) are shown].
In contrast, Heihe Middle Bridge was almost intact. As shown in Figure 1C, only minor concrete cracks were observed at the abutments, resulting from slight longitudinal and transverse pounding from the girders. The bents were unaffected and remained intact. Overall, the bridge remained fully functional for traffic.
Besides, soil liquefaction phenomena were observed near the bridge sites [37]. Therefore, liquefaction severity is assessed using both Liquefaction Potential Index (LPI) from the Chinese code [42] and the well-known Ishihara-inspired Liquefaction Potential Index \mathrm {( L P I _ { I S H} ) } [43], as detailed in Appendix B. The reason for this assessment is to develop simplified spring models of the bent foundations accounting for the liquefaction-induced soften soils. It should be noted that, since no apparent permanent displacement of the Yematan Bridge piers was identified [44], the contribution of liquefaction-induced lateral spreading to the observed damage is considered less influential and is not considered in this study.
3 Bridge Finite Element Model
To quantify the impact of different span configurations on pounding-associated bridge damage, a parametric finite element (FE) model is established in OpenSees \phantom {-} \ V 2 . 6 . 0 [45] for highly efficient numerical modeling. This model features a variable span configuration, denoted as M \times N , , where M is the number of frames, and N is the number of spans per frame. The model is shown in Figure 2. Detailed modeling methods of bridge components are elaborated as follows.
3.1 Girders and Bents
The superstructure is simulated by a spine model with girders mimicked using“elasticBeamColumn"elements. The columns of bents are modeled using nonlinear“dispBeamColumn"elements with a discretization dimension of 0 . 4 \mathrm {m} (nearly one third of the column diameter) with five integration points for each element. The compressive stress-strain behavior of confined concrete is modeled based on the Mander model [46, 47], while the tensile strength of concrete is determined following [48].
3.2 Expansion Joints and Continuous Decks
At expansion joints, pounding elements are adopted to simulate longitudinal pounding between girders or between girders and abutments. The pounding behavior is modeled using the simplified Hertzdamp model (i.e., the uniaxial “ImpactMaterial"in OpenSees) proposed by Muthukumar [49]. As shown in Figure 2, stiffness parameters k _ {1} , k _ {2} and \delta _ {y} can be calculated using the stiffness parameter k _ {h} and the coefficient of restitution e of Hertzdamp model according to [49]. In this paper, k _ {h} is set as the axial stiffness of one-span girder [49, 50], and e is taken as 0.7, as its typical value ranges from 0.6 to 0.8 [49]. The maximum penetration is determined by preliminary calculations using linear pounding spring under the same conditions [49]. In a bridge frame, the concrete continuous decks between adjacent simply supported girders are modeled as rigid links, as they resist axial tension and compression, maintaining the connection before girder collapse.
3.3 Abutments
The abutment is modeled using two serial zero-length elements, each assigned to the uniaxial “HystereticSM”and “Impact-Material”materials, respectively. The“HystereticSM”material is defined by a macro constitutive model of abutment (see the abutment spring subfigure in Figure 2) to represents the abutment nonlinear behavior and capture the girder-abutment interaction in dynamic analyses of full-bridge model. Note that this macro constitutive model of the abutment and associated failure displacement of 0 . 1 3 6 \mathrm {m} , at which the backwall fractures at its bottom and separates from stem wall, are derived from a recent study by the authors [39]. Besides, following the abovementioned girder-to-girder pounding simulation, the“ImpactMaterial”is again used to simulate the girder-to-abutment pounding considering the expansion joint gap at abutments.
3.4 Bearings
Unbonded laminated rubber bearings with stainless steel-PTFE (polytetrafluoroethylene) sliding interface are used for both bridges. Specifically, a stainless-steel plate is embedded at the bottom of the concrete girder, while a PTFE layer is placed on top of the bearings, forming a low-friction sliding interface. In other words, from the perspective of bearing design, both bridges are configured as seismically isolated structures. When an earthquake comes, it is quite challenging to simulate the actual bearing state. Several factors contribute to this complexity, including variations in the friction coefficient from the as-built condition due to wear, corrosion, and environmental changes (e.g., temperature and humidity), and most importantly, unstable contact conditions between the girders and the bearings (e.g., detachment or unseating). Given these uncertainties, a parametric study on the friction coefficient is warranted. In this study, the bearings are modeled by an elastic perfectly-plastic constitutive model, where the yield force is defined based on the friction coefficient. The initial stiffness of the bearings is set at 1 0 0 0 \mathrm {k N / m} as designed. For the parametric analysis, three friction coefficients (0.05, 0.2, and 0.4) are examined according to the following justifications:
-
Field observations showed that the bottom sections of bridge bents generally remained elastic, primarily due to the seismically isolated design. Thus, the bending moment sustained by a column at its bottom should not exceed its equivalent yield bending moment of 3 8 6 5 \mathrm {k N \cdot m} . This moment, combined with the height of the tallest bent (4 . 5 \mathrm { m} ) , generates a horizontal force of 1 7 1 8 \ \mathrm {k N} at the top of the bent, corresponding to a friction coefficient of 0.43 as the upper limit.
-
The friction coefficient of a stainless steel-PTFE sliding interface typically ranges between 0.08-0.2 without lubrication and 0.01-0.03 with lubrication [51];
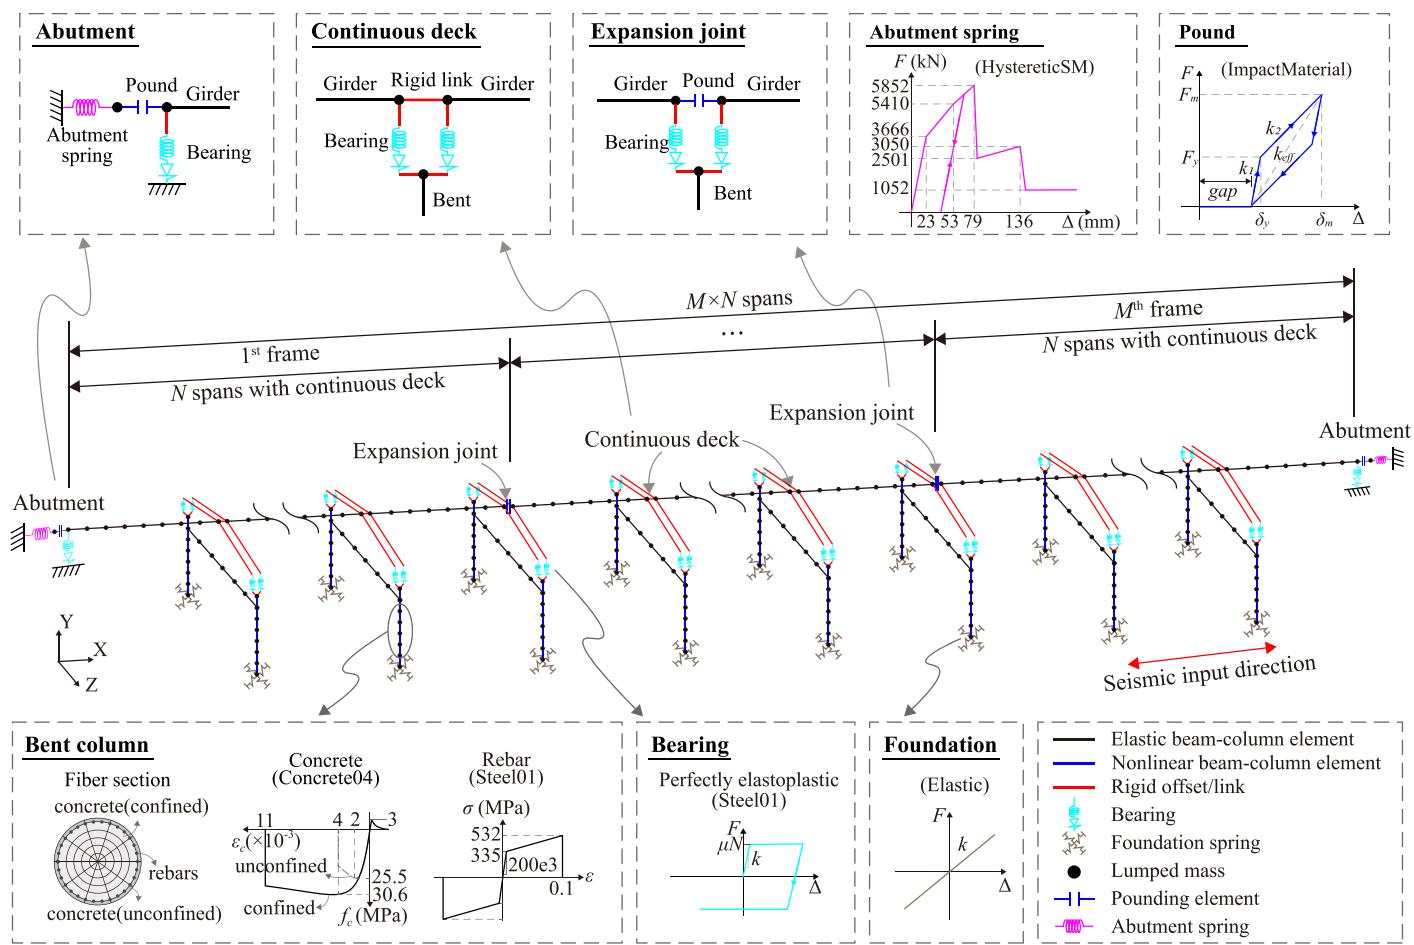
FIGURE 2 | Parametric finite element (FE) model of bridge with M \times N spans.
- Detachment between the girder and bearing due to unseating effectively mitigates friction forces, corresponding to a friction coefficient of 0.00, and significantly increases displacement demand.
3.5 Foundation
The foundations of the bents are modeled using elastic six degree-of-freedom (6-DOF) springs, with the stiffness determined by the M-method in the Chinese code [52], which is a simplified foundation modeling approach based on elastic soil-pile springs to calculate the six-DOF stiffness of the whole foundation. Soil liquefaction effects are considered by reducing soil strength properties via reduction factors based on liquefaction potential or severity indicators (see details in Appendix B); thereby the resulting foundation stiffness modeling technique is named FM_Liq in Table 1. Note that past studies on foundation modeling may consider nonlinear soil-pile behavior [53], thereby a further investigation on the sensitivity of foundation stiffness to bearing displacement demands is carried out in this paper. Two additional stiffness modeling techniques are examined, namely FM_Nonliq for the M-method without liquefaction effect, and F_Fix for fixed foundation represented by very large stiffness, as listed in Table 1. Accordingly, mean displacement responses of all bearings for bridges with different foundation stiffness modeling under synthetic pulse-like ground motions (see next section) are compared in Figure 3. From Table 1, the horizontal stiffness of FM_Liq is reduced to approximately 2 / 3 of FM_Nonliq due to liquefaction, yet the differences in bearing displacement responses across the three modeling techniques are quite small for both bridges, as seen that the results mostly lie on the 1: 1 lines in Figure 3. These results indicate that foundation stiffness has little impact on the bearing displacement responses, implying that soil liquefaction may not be the major reason for the unseating and collapse of Yematan Bridge. These results also follow the findings in past studies, such as Dicleli et al.[54].that foundation stiffness has little influence on bearing seismic displacement responses of isolated highway bridges.
4 Near-Fault Pulse-Like Ground Motions
Due to the sparse distribution of monitoring stations, strong ground motion recordings are unavailable at the bridge sites, necessitating the use of synthesized ground motions. To this end, characteristics of the fault and the bridge site are first investigated via in-depth literature review, as detailed in Appendix C for conciseness and legibility. The present section highlights how ground motion intensity parameters at the bridge site, particularly pulse velocity and period, are estimated. These parameters are then used to generate the possible ground motions. In addition, the apparent wave velocity is explored to facilitate the later parametric analysis on wave-passage effects. Note that Yematan Bridge and Heihe Middle Bridge are assumed to experience the same input due to their proximity.
TABLE 1 | Stiffness of 6-DOF springs for modeling foundation.
| Foundation stiffness modeling | Translational stiffness (10^4 kN/m) | Rotational stiffness (10^4 kN·m/rad) | |||||
| X | Y | Z | Rx | Ry | Rz | ||
| FM_Liq: M-method w/ liquefaction | 9.74 | 325 | 9.74 | 260 | 52.0 | 260 | |
| FM_Nonliq: M-method w/o liquefaction | 16.7 | 315 | 16.7 | 290 | 57.9 | 290 | |
| F_Fixed: Fixed foundation | 10000 | 10000 | 10000 | 10000 | 10000 | 10000 | |
Note: X corresponding rotational DOFs.
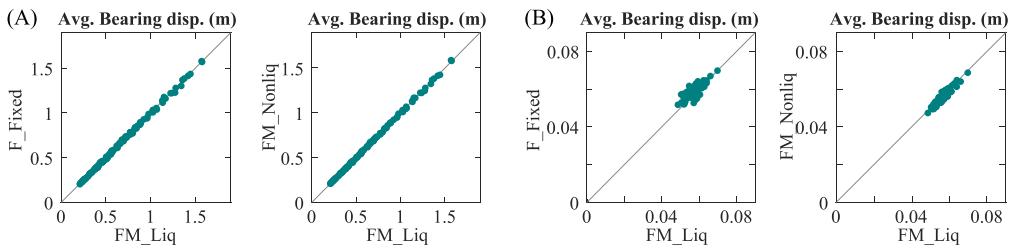
FIGURE 3 | Comparison of bearing displacement responses for bridges with different foundation stiffness modeling techniques (FM_Liq, FM_Nonliq, and F_Fixed described in Table 1) under synthetic pulse-like ground motions: (A) Yematan Bridge, and (B) Heihe Middle Bridge.
TABLE 2 | Ground motion intensity parameters at bridge site.
| Source | PGA (g) | PGV (cm/s) | Vp (cm/s) | Tp (s) | |
| Official agencies | CEA | 0.41-0.85 | 1 | 1 | |
| Publications of other researchers | USGS [62] | >0.2 | >50 | ||
| Cai et al. [63] | 0.33 | 1 | |||
| Zu et al. [38] | 0.68 | 一 | |||
| Derived from empirical formulas | Li et al. [64] | 0.33-0.63 | 1 | 1 | |
| Yuan et al. [37] | 0.45 | 一 | |||
| Liu et al. [65] | 0.39 | 1 | 1 | ||
| Fu and Menun [57] | 1 | 70 | 4.1 | ||
| Bray and Rodriguez-Marek [56] | 1 | 106 (65-173) | 95 (58-155) | 3.6 (2.0-6.4) | |
| Cork et al. [60] | 1 | 78 (51-105) | 70 (46-95) | 5.6 (4.3-7.2) | |
| Broad ranges from all the above results | 0.2-0.85 | 51-173 | 46-155 | 2.0-7.2 | |
Note: The values in parentheses provide the range of one standard deviation
4.1 Determination of Near-Fault Ground Motion Parameters
Some researchers and organizations have predicted the ground motion intensity parameters of the 2021 Maduo earthquake at the studied bridge site. For instance, the China Earthquake Administration (CEA) reported a peak ground acceleration (PGA) ranging from 0.41 to _ {0 . 8 5 \mathrm { ~ g ~} } [55], while United States Geological Survey (USGS) suggested PGA values exceeding _ {0 . 2 \ \mathrm { \ g} } . Table 2 summarizes the predicted PGA, together with peak ground velocity (P G V) , pulse velocity (V _ { p} ) , and pulse period (T _ { p} ) values of ground motions at the bridge site from official agency reports, journal publications, and those derived from empirical equations. These predictions indicate significant variability, with PGA estimates ranging from _ {0 . 2 \ \mathrm { g} } to 0 . 8 5 \mathrm {g}
Velocity pulses, typical of near-fault ground motions, may occur in the fault-normal direction for strike-slip faults when seismic shear waves superimpose as the rupture propagates toward the site at a velocity close to the shear Wave velocity [56, 57]. This phenomenon is called forward directivity. The bridge site meets the conditions for the occurrence of forward directivity for a strike-slip event as described by Bray and Rodriguez-Marek [56]: (1) fault rupture propagates toward the site because it propagated bilaterally to both the west and east from the epicenter [40, 58, 59], and (2) there is a small angle between the direction of rupture propagation and the direction of waves traveling from the fault to the site, as the bridge site is located 3 1 \mathrm {k m} west of the epicenter and along the fault trace (see Figure 1). Furthermore, obvious pulses are observed in fault normal component of the recordings at the DAW station, even though it is located 1 7 5 \mathrm {k m} east of the epicenter [38]. Therefore, based on the above, it is highly likely that the ground motions in the longitudinal direction of the bridges contain a pulse-like component induced by forward-directivity effects.
The pulse parameters in near-fault ground motion, such as T _ {p} , V _ {p} and P G V , are related to moment magnitude \left(M _ { w} \right) and rupture distance (R _ { r u p} ) . Their relationships have been quantified through empirical attenuation formulas, for example, Equations (1), (2), and (3) proposed by Fu and Menun [57], Bray and Rodriguez-Marek [56], and Cork et al. [60], respectively:
The predicted values derived from these formulas are listed in Table 2. Halld6rsson et al.[61]. reported that V _ {p} ranges from 0.85 to 1.0 times P G V ; therefore, V _ {p} = 0 . 9 ~ P G V is adopted to calculated V _ {p} . To provide a comprehensive overview of P G A , PGV, V _ {p} and T _ {p} , the last row of Table 2 outlines the broad ranges of these parameters from the aforementioned publications and empirical estimates. These ranges serve as a reference for selecting the examined parameter values in the subsequent parametric analyses.
4.2 Generation of Pulse-Like Ground Motions
4.2.1 Pulse-Like Ground Motions
Due to considerable variability in the predicted ground-motion intensity parameters (Table 2), this study focuses on the effects of pulse parameters (i.e., T _ {p} and V _ {p .} ), which are shown later to be the primary contributors to the observed damage. The process of generating the synthetic ground motions is illustrated in Figure 4A. A site-specific target response spectrum predicted specifically for the Yematan Bridge site (Liu et al. [65].) was adopted to select seven spectrum-compatible near-fault (R _ { r u p} < 2 0 ~ \mathrm {k m} ) pulse-like recordings from the PEER database. The pulse components of these recordings were identified and extracted using the method proposed by Mimoglou et al. [66]. (Figure 4B). As per [57, 67], synthetic motions were generated by superimposing the same set of seven high-frequency components onto pulse waves with varying T _ {p} and V _ {p} . Specifically, according to Table 2, T _ {p} varied from 2 to7 s at intervals of _ {0 . 5 \mathrm { ~ s ~} } and V _ {p} from 50 to 1 4 0 ~ \mathrm {c m / s} at intervals of 1 0 \ \mathrm {c m / s} , resulting in 110 T _ {p} \mathrm {~ - ~} V _ {p} combinations and thus 110 sets of synthetic pulse-like ground motions, each consisting of seven ground motions with identical T _ {p} and V _ {p}
It should be noted that the same seven high-frequency components were used for all synthetic motions to ensure that response variability is primarily governed by the pulse parameters rather than the high-frequency content. For each T _ {p} - V _ {p} combination, unless otherwise specified, the average response of the seven synthetic motions was used, which is consistent with standard seismic design practice, thereby allowing a clearer interpretation of pulse effects, while maintaining a reasonable computational cost.
The 5 \% damped acceleration response spectra for all 770 synthetic pulse-like ground motions are displayed in Figure 4C. For comparison, the predicted site spectrum by Liu et al.[65].and the average spectrum (along with the associated spectra representing median plus/minus one standard deviation) from four widely recognized NGA West-2 ground motion prediction equations (GMPEs)(i.e., ASK14 [68], BSSA14 [69], CB14[70], and CY14 [71]) are also plotted in Figure 4C. It is clear that the spectra of the 770 synthetic pulse-like ground motions generally well fit the range bounded by the NGA West-2 GMPEs.
4.2.2 Non-Pulse-Like Ground Motions
Seven non-pulse-like ground motions are also selected to provide a baseline for comparison and to highlight the higher damaging potential of pulse-like motions. The acceleration response spectrum at bridge site estimated by Liu et al. [65]. is adopted as a target spectrum. Figure 4D shows their 5 \% damped acceleration response spectra.
4.3 Apparent Wave Velocity at Bridge Site
The wave-passage effect is a primary source of spatial variation in seismic motions, particularly for long bridges, caused by the differences in arrival times of seismic waves at various bridge support locations due to their differing distances from the epicenter [72, 73]. The wave-passage effect can be accounted for by adding a time delay t _ {d} to the input motions of different bridge supports [33, 74]. The time delay t _ {d} can be calculated by [75, 76]
where L is the distance between different supports; \bar {v} _ {a p p} and v _ {a p p} are the apparent wave velocity along the bridge axis and along the direction of wave propagation, respectively; \alpha represents the angle between the bridge's longitudinal axis and the direction from the epicenter to the bridge site; \nu _ {s} denotes shear wave velocity and \beta denotes the incidence angle of the seismic wave. The spatial relationship between the studied bridge site and the seismic source (see Figure C1 in Appendix C) leads to \bar {v} _ {a p p} = 4 0 8 \mathrm {m / s} \approx 4 0 0 \mathrm {m} / \mathrm {s} . Thus, the time delay t _ {d} = 0 . 0 5 s applies to bridge supports with an interval of 2 0 \textrm {m} . It is important to note that the wave propagation direction along the bridge axis is from north to south.
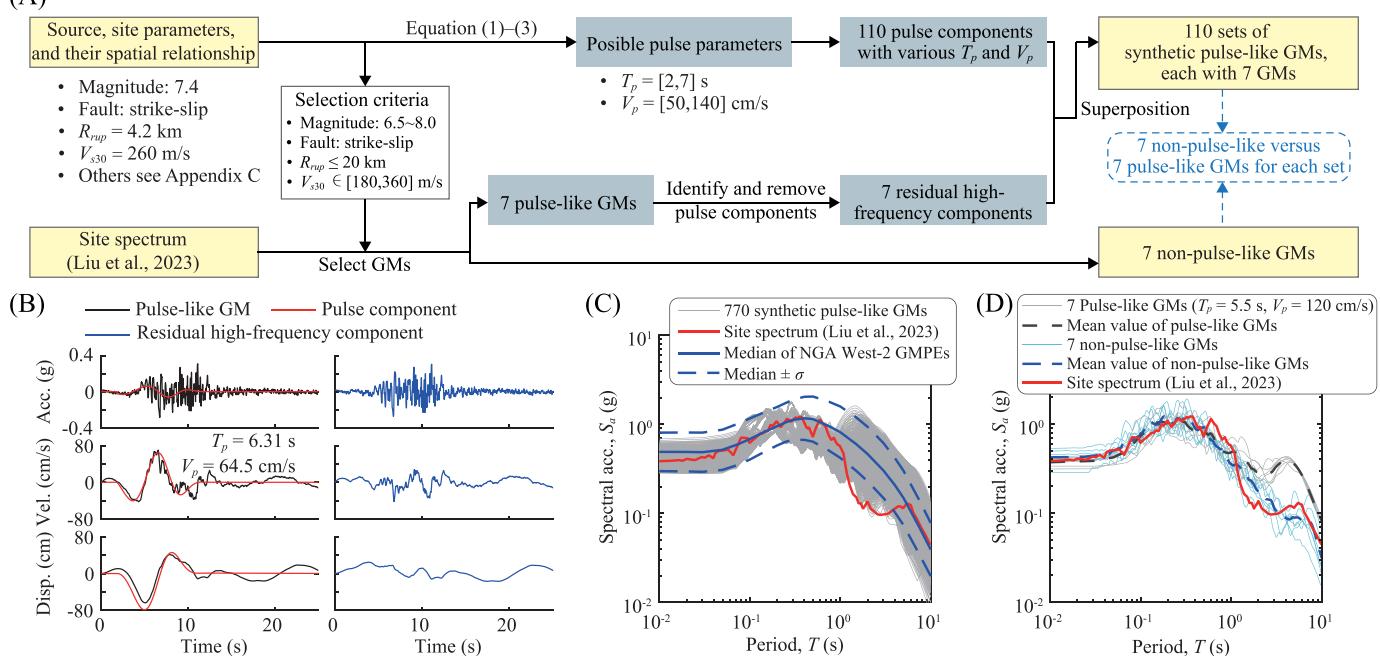
FIGURE 4 | Adopted ground motions: (A) flowchart of generating near-fault ground motions (GMs); (B) example of extracting residual high-frequency component from pulse-like GM (RSN 1161, Wave 5); acceleration spectra for (C) 770 synthetic pulse-like GMs and (D) 7 non-pulse-like GMs versus 7 pulse-like GMs with T _ {p} = 5 . 5 s and V _ {p} = 1 2 0 \mathrm {c m / s} as an example.
5 Reproduction of Bridge Damage and Chain Pounding Phenomena Under Specific Ground Motions
In this section, the seven non-pulse-like ground motions and their seven pulse-like counterparts-characterized by a specific set of intensity parameters ( T _ {p} = 5 . 5 ~ \mathrm {s} , V _ {p} = 1 2 0 \ \mathrm {c m / s} , which are nearly the median values within the broad ranges summarized in Table 2)-are used to perform nonlinear time-history analyses for Heihe Middle Bridge ( \mathrm {1} \times 3 spans) and Yematan Bridge ( 5 \times 5 spans). The bearing friction coefficient \mu is set as 0.05 in this section, and full parametric analyses of various V _ {p} , T _ {p} , and \mu values will be presented in the next section.
5.1 Description of Shifted Displacement Time-History Plot and Novel Pounding Gantt Plot
To illustrate girder-to-girder/abutment pounding phenomena more clearly, this study adopts a shifted displacement time-history plot that explicitly incorporates the initial gaps between the girders of each frame and the two-sided abutments. Such a shifted displacement time-history plot has been previously employed by Jankowski et al. [77]. In addition, a novel plotting form named “pounding Gantt plot”is proposed in this study. For clarification, Figure 5 presents these plots using Yematan Bridge subjected to a specific pulse-like ground motion (Wave 5, with P G A = 0 . 3 1 \mathrm {g} , P G V {=} 1 2 4 \mathrm {c m / s} , T _ {p} = 5 . 5 {\mathrm { s} } V _ {p} {=} 1 2 0 \mathrm {c m} / \mathrm {s} , and \bar {v} _ {a p p} = 4 0 0 \mathrm {m} / \mathrm {s} accounting for the wave-passage effect) as an example.
In the shifted displacement time-history plot (Figure 5B), the initial gaps between two adjacent components (see Figure 5A) define the starting points of their displacement time histories. Specifically, the north abutment begins at zero displacement,
Girder 5 (i.e., the girder of frame 5) at - 0 . 0 8 \mathrm {~ m ~} (the gap between the north abutment and Girder 5), and Girder 4 at - 0 . 2 4 \mathrm {~ m ~} (the sum of the gap between Girder 5 and 4 and the gap between north abutment and Girder 5). This pattern continues for the remaining girders and the south abutment. In this example, the relative displacements with respect to the north abutment are used, so the north abutment remains at zero displacement at all times in order to more clearly visualize the successive pounding events near the north abutment. As seen from the zoom-in part of Figure 5B, crossovers between the displacement time-history curves of two adjacent components signify these pounding events, marked by red circles and labeled “p1-p11” in chronological order. Note that strictly speaking, each pounding event results in two intersection points between the two adjacent displacement curves, because the adopted “ImpactMaterial"for pounding simulation has finite stiffness rather than being perfectly rigid, leading to a minor"penetration”between the impacting components.
Based on such a shifted displacement time-history plot, a rhythmic and successive pounding phenomenon between girders and abutments is shown. At the onset of these poundings, all girders move northward. The first pounding (p1) occurs between the north abutment and Girder 5, lasting approximately 2s. Meanwhile, this pounding reduces the velocity of Girder 5, which in turn triggers the second pounding (p2) between Girder 5 and 4. Again, the second pounding (p2) decelerates Girder 4, inducing the third pounding (p3) between Girder 4 and 3. Subsequently, the third pounding (p3) decelerates Girder 3 whereas simultaneously accelerates Girder 4, triggering the fourth pounding (p4) between Girder 4 and 5, and the fifth pounding (p5) between Girder 3 and 2. This chain of interactions continues until the last pounding (p11) occurs between north abutment and Girder 5. This rhythmic and successive pounding phenomenon is referred to as “chain pounding phenomenon” in this study.
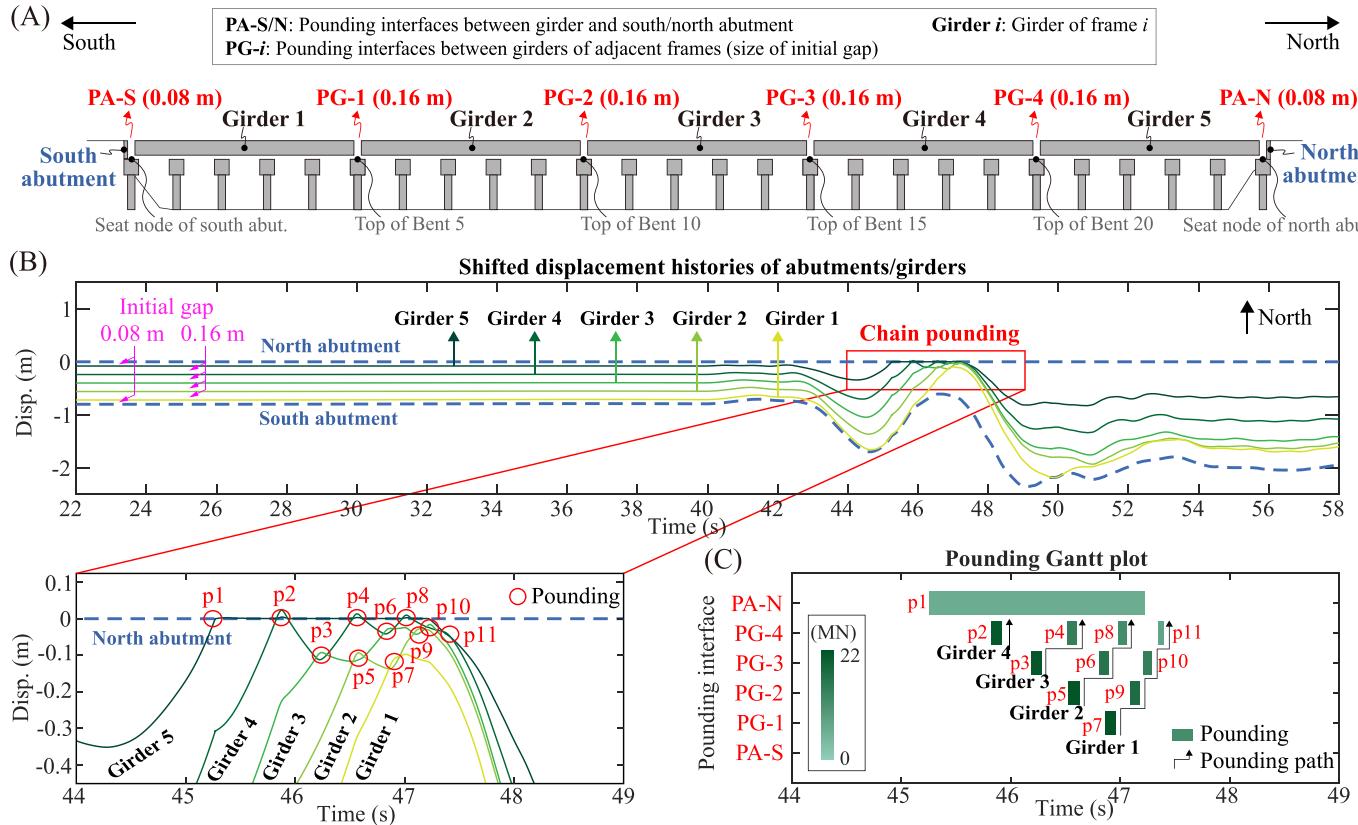
FIGURE 5 | Description of shifted displacement time-history plot and pounding Gantt plot for illustrating girder-to-girder/abutment chain pounding phenomenon: (A) elevation view of the Yematan Bridge showing the abutments, girders, and the initial gaps between them, (B) shifted displacement time history plot with zoom-in display, and (C) pounding Gantt plot.
The chain pounding phenomenon is more explicitly illustrated by a proposed “pounding Gantt plot"shown in Figure 5C, which visualizes spatial-temporal evolutions of these pounding events. Inspired by traditional Gantt plots in project scheduling, the horizontal axis represents time, while the vertical axis represents different pounding interfaces (denoted as PA-N, PG-4, etc.; see Figure 5A). Each horizontal strip represents a pounding event, with its width reflecting the pounding duration, and its color gradient indicating the magnitude of pounding force. The vector arrows illustrate the pounding paths. For instance, the aforementioned first pounding between north abutment and Girder 5 that lasts approximately 2 s is clearly observed, which is significantly longer than the durations of girder-to-girder poundings. This long duration is attributed to the significant plastic deformation of the north abutment as interpreted later. A notable feature of chain pounding, clearly illustrated by the proposed “pounding Gantt plot", is that these individual pounding events form an inverted triangular pattern in the time-space relationship, with the number of girder-to-girder pounding events decreasing from north to south (namely the reduction of pounding frequency). Moreover, at positions experiencing multiple pounding events, the first one generates the largest pounding force, followed by a gradual decrease in subsequent events. Furthermore, from the perspective of the north abutment, chain pounding is highly detrimental, as it facilitates the transfer of seismic kinetic energy from the southern girders to the northern girders and abutment (see pounding paths in Figure 5C), thereby increasing displacement demands on the northern girders and thus the north abutment. This issue is further discussed in detail in Section 6.4.
5.2 Damage Characteristics of Two Bridges Against Pulse-Like and Non-Pulse-Like Ground Motions
The seismic responses of the two bridges subjected to the aforementioned seven non-pulse-like and pulse-like ground motions with specific pulse velocity and period are compared in Figure 6, where the wave-passage effect is also considered. The top bar plots illustrate the average bearing displacements and the displacements of north abutments, while the bottom shifted displacement time-history plots and corresponding pounding Gantt plots depict the pounding behavior at adjacent girders and abutments under a specific wave (Wave 5). Since the wave-passage effect is considered, the shifted displacement time-history plots adopt relative displacements with respect to the seat node of north abutment (see Figure 5A). This allows the north abutment displacement to be explicitly shown, thereby facilitating direct comparison with observed abutment (backwall) displacement detailed in Section 2.
Under non-pulse-like ground motions, the two bridges exhibit similar seismic behavior. Owing to the effective constraint from the abutments, the bearing displacements remain far below the girder-falling limit ( \mathrm {0 . 8 3 m} , defined as the bearing displacement at which the girder end exceeds the bent-cap edge). The abutments sustain only slight damage but do not fail. However, these results do not match the field-observed seismic damage because pulse-like motions are expected for both bridges. Under pulse-like ground motions, seismic responses of the 1 \times 3 -span Heihe Middle Bridge remain small due to the effective abutment constraints.
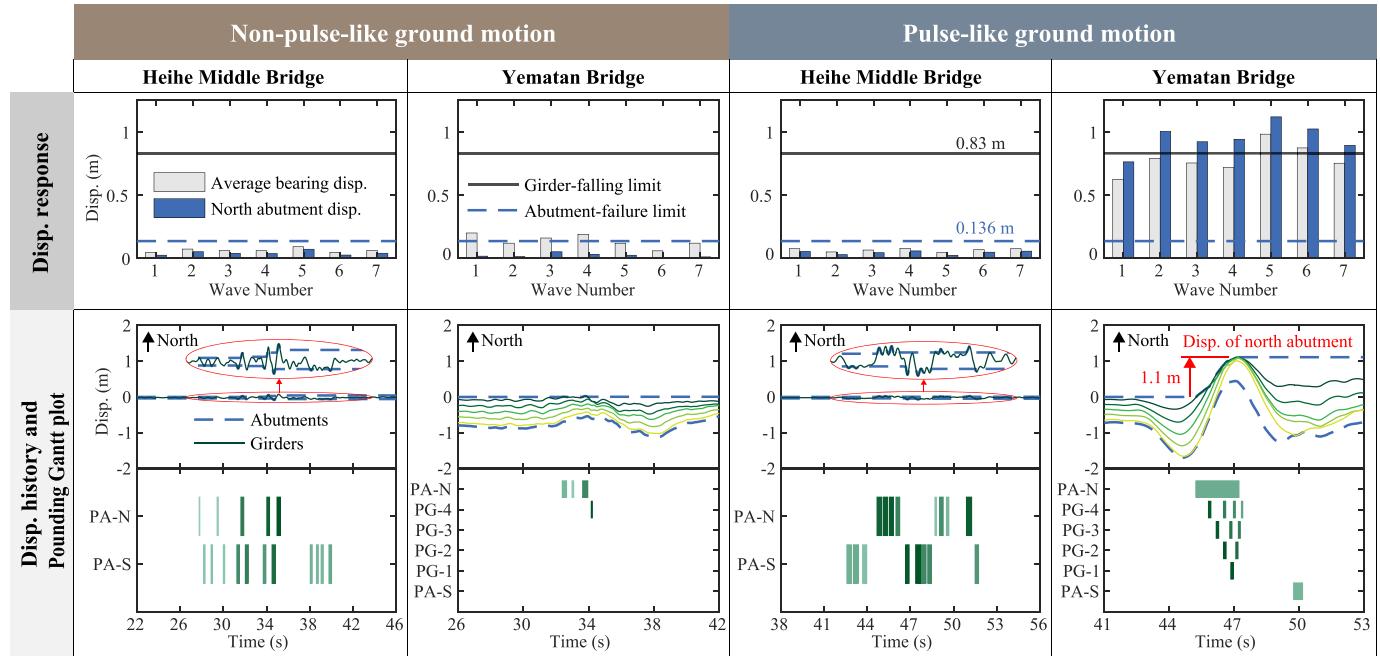
FIGURE 6 | Bearings and abutments displacements (top row) under seven non-pulse-like ground motions (\bar { v} _ {a p p} = 4 0 0 \mathrm {m / s) } and seven pulse-like ground motions (T _ {p} = 5 . 5 ~ \mathrm {s} V _ {p} = 1 2 0 \mathrm {c m / s}, \bar {v} _ {a p p} = 4 0 0 \mathrm {m / s} )), and shifted girders/abutments displacement histories with pounding Gantt plots (bottom row) under Wave 5 for Heihe Middle Bridge and Yematan Bridge.
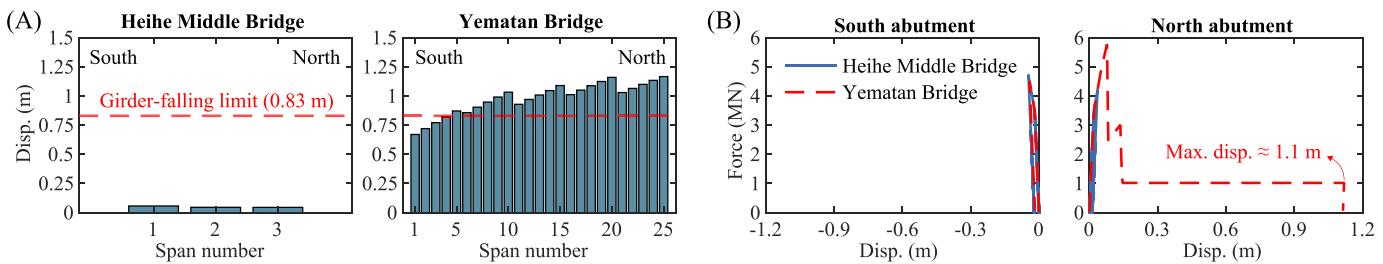
FIGURE 7 | Responses of Heihe Middle Bridge and Yematan Bridge under pulse-like ground motion Wave 5 (\begin{array} {r} {P G A = 0 . 3 1 \mathrm { \ g} . } \end{array} P G V = 1 2 4 ~ \mathrm {c m / s} T _ {p} = 5 . 5 V _ {p} = 1 2 0 \mathrm {c m / s} \bar {v} _ {a p p} = 4 0 0 \mathrm {m / s) }): (A) bearing displacement distribution across all spans (bents); (B) abutment force-displacement responses. These results reproduce the key damage patterns at the two bridges: the girder-falling pattern (mostly on the northern side) and the north abutment failure of Yematan Bridge, in contrast to the almost intact condition of Heihe Middle Bridge.
In contrast, the 5 \times 5 \cdot -span Yematan Bridge exhibits substantially larger responses: the average bearing displacements under the seven motions approach or even exceed the girder-falling limit, while the abutment displacements far surpass the abutment-failure limit ( \mathrm {0 . 1 3 6 ~ m} , corresponding to backwall failure at the bottom and separation from stem wall). Overall, responses under pulse-like ground motions are more consistent with the field-observed seismic damage (recall Section 2) than those under non-pulse-like motions, highlighting the necessity of incorporating pulse effects into ground motion inputs.
To further clarify the damage characteristics of bearing, girder, and abutment of the two bridges under pulse-like motions, Figure 7 compares their bearing displacement distributions across all spans (bents) and force-displacement responses of abutments under pulse-like Wave 5 ( T _ {p} = 5 . 5 \mathrm {~ s ~} , V _ {p} = 1 2 0 ~ \mathrm {c m / s} , \bar {v} _ {a p p} = 4 0 0 \mathrm {m / s} ) . In Figure 7A, the bearing displacements of Heihe Middle Bridge are far below the girder-falling limit, whereas a large proportion of the northern bearings of Yematan Bridge exceed the girder-falling limit, indicating girder falling.
This result aligns with the observed seismic damage of girders. Additionally, in Figure 7B, the abutments of Heihe Middle Bridge are slightly damaged, whereas the north abutment of Yematan Bridge exhibits apparent failure (maximum displacement of 1.1 m) yet the south abutment is marginally damaged. This result is also consistent with post-earthquake field observations of abutments [39]. The damage patterns of both bridges are successfully reproduced under specific pulse-like ground motions. These results shown pulse-like motions are more harmful to long bridges, such as Yematan Bridge, than to short bridges like Heihe Middle Bridge. To explore more generalized findings, a detailed parametric analysis of bridge length (spans and frames) and pulse parameters ( \mathrm {T} _ {p} and V _ {p ,} ) is presented in the next section.
6 Parametric Analyses of Chain Pounding and Collapse Mechanisms
To further explore the underlying mechanisms of bridge collapse and associated chain pounding phenomena, a series of parametric
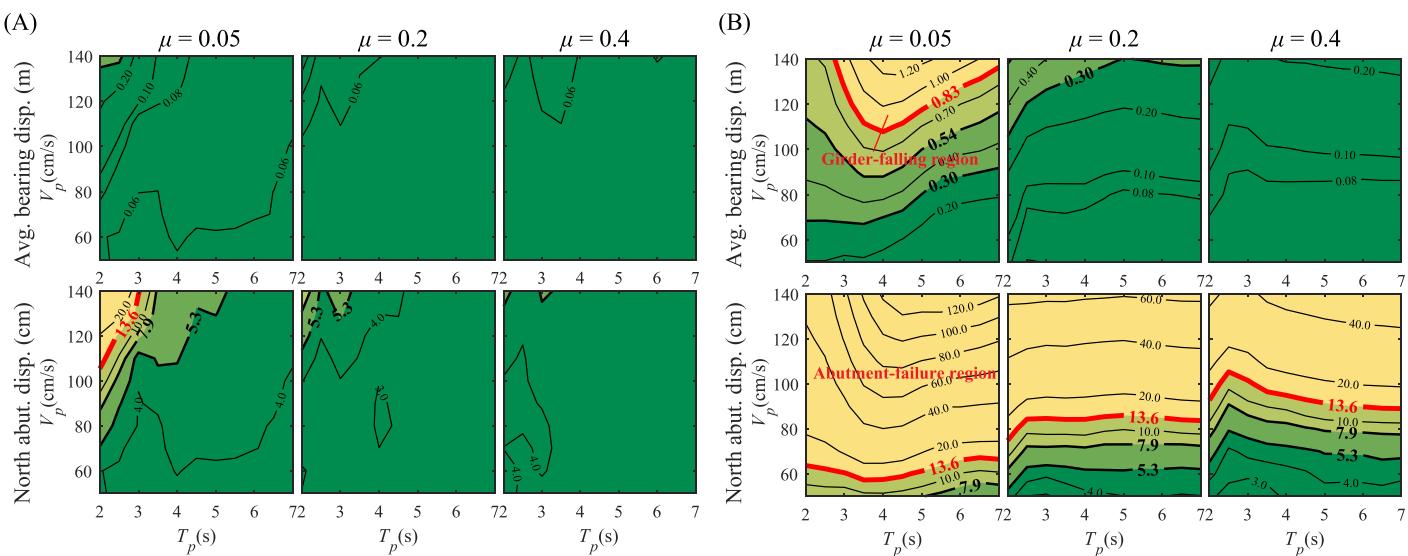
FIGURE 8 | Effect of pulse parameters (i.e., T _ {p} and V _ {p ,})of ground motions on the average bearing displacement and north abutment displacement for (A) Heihe Middle Bridge ( 1 \times 3 spans)and (B) Yematan Bridge 5 \times 5 spans) with different bearing friction coefficients (\mu)
analyses are conducted to investigate effects of pulse parameters T _ {p} and V _ {p ,} ), wave passage, and numbers of spans and frames.
6.1 Effect of Pulse Periods and Velocity Amplitudes
Figure 8 illustrates the effects of T _ {p} and V _ {p} on the average bearing displacements and north abutment displacements of Heihe Middle Bridge and Yematan Bridge with different bearing friction coefficients ( \mu = 0 . 0 5 , 0.2, and 0.4). Each contour plot is generated from 110 data points, where each point represents the mean response of seven ground motions with identical T _ {p} and V _ {p} values, and a wave-propagation velocity of \bar {v} _ {a p p} = 4 0 0 \mathrm {m} / \mathrm {s} In these plots, the limit displacements that cause girder falling (0 . 8 3 ~ \mathrm { m} ) and abutment failure (1 3 . 6 \mathrm { c m} ) are highlightedby thick red lines, and by which the T _ {p} \mathrm {~ - ~} V _ {p} parameter regions enclosed arereferred to as“girder-falling region”and “abutment-failure region"hereafter.
The results show remarkably different behavior between two bridges. From Figure 8A for Heihe Middle Bridge ( 1 \times 3 spans), bearing and abutment displacement responses decrease with the increasing bearing friction coefficient, but still are relatively small compared with Yematan Bridge ( 5 \times 5 spans). Girder falling does not occur at any T _ {p} - V _ {p} combinations for Heihe Middle Bridge. Moreover, the north abutment failure only occurs at quite short pulse periods ( (T _ { p} < 3 . 0 ~ \mathrm {s} ) andhigh velocity amplitudes (V _ { p} > 1 1 3 \mathrm {c m} / \mathrm {s} , for low friction coefficient \textstyle \mathcal {J} \mu = 0 . 0 5 , , which is indeed quite extreme condition.
From Figure 8B for Yematan Bridge ( 5 \times 5 spans), the displacement responses also decrease as the bearing friction coefficient increases, especially from \mu = 0 . 0 5 to \mu = 0 . 2 . Both girder falling and abutment failure occur for \mu = 0 . 0 5 , and even for larger \mu , abutment failure occurs in more than half of the examined T _ {p} {-} V _ {p} combinations, especially at larger V _ {p} (e.g., V _ {p} > 1 0 0 \ \mathrm {c m / s} regardless of T _ {p} ) . For \mu = 0 . 0 5 , amoderate T _ {p} (i.e., around 4 \ \mathbf {s} ) ) will cause maximum responses. Besides, the results also imply that abutment failure could be a necessary precondition for girder falling because the abutment-failure region is always larger than and encompasses the girder-falling region, which further underscores that the abutment failure is a crucial factor that causes the eventual collapse of Yematan Bridge.
The pounding behavior of Yematan Bridge is also influenced by pulse parameters. Figure 9 presents the shifted displacement time-history plots (absolute displacements are adopted) and pounding Gantt plots in terms of different T _ {p} and V _ {p} under bearing coefficient of \mu = 0 . 0 5 As T _ {p} and V _ {p} increase, the inverted triangle-shaped time-space distribution of pounding events becomes more distinct. Specifically, significant chain pounding phenomena are more frequently observed when T _ {p} > 4 . 0 s
6.2 Effect of Wave Passage
To demonstrate the impact of wave-passage effect on the girder-to-girder/abutment chain pounding and collapse mechanisms of the Yematan Bridge, Figure 10 shows shifted displacement time-history plots (absolute displacements are adopted) and pounding Gantt plots under the specific pulse-like ground motion Wave 5 \begin{array} {r} {P G A = 0 . 3 1 \mathrm { \bf ~ g} . } \end{array} P G V = 1 2 4 ~ \mathrm {c m / s} , T _ {p} = 5 . 5 s, V _ {p} = 1 2 0 \ \mathrm {c m / s} ) and a bearing friction coefficient of \mu = 0 . 0 5 . Compared with the uniform excitation case (i.e., without wave-passage effect), the wave-passage effect generally increases the pounding force, frequency, duration, and the number of participating girders. This is because the wave-passage effect causes phase differences (or phase delays) in the movement of girders and abutments, which could be clearly observed in their displacement histories.
Figure 11 illustrates the bearing displacement distributions across all spans under different pulse periods of ground motion. The results show that the wave-passage effect has a remarkable influence on the bearing displacement distribution. Specifically, the southern bearing displacements are generally larger than those of the northern bearings when the wave-passage effect is not considered. However, this distribution pattern changes when the wave-passage effect is considered: the northern bearing displacements gradually become larger than the southern ones as the pulse period (T _ { p} ) of ground motion increases, particularly when T _ {p} > 4 . 0 ~ \mathrm {s} , , at which point chain pounding also becomes significant. Such a bearing displacement distribution pattern is consistent with the field-observed girder-falling pattern of Yematan Bridge, implying that the wave-passage effect is an additional crucial factor to trigger the field-observed damage. Moreover, considering the wave-passage effect always results in smaller average bearing displacements.
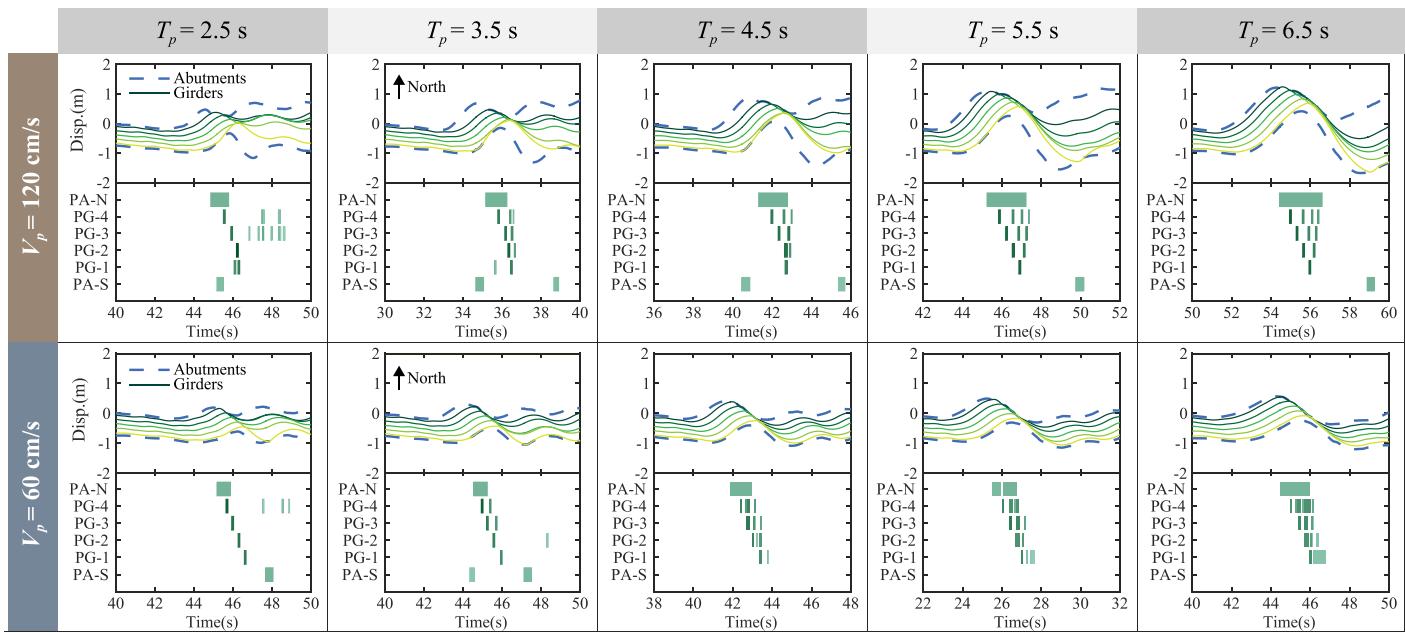
FIGURE 9 | Effect of pulse parameters (i.e., T _ {p} and V _ {p}) of ground motion on the chain pounding behavior of Yematan Bridge (Wave 5 with varied T _ {p} and V _ {p ,}); the chain pounding is significant when T _ {p} > 4 . 0 ~ \mathrm {s}
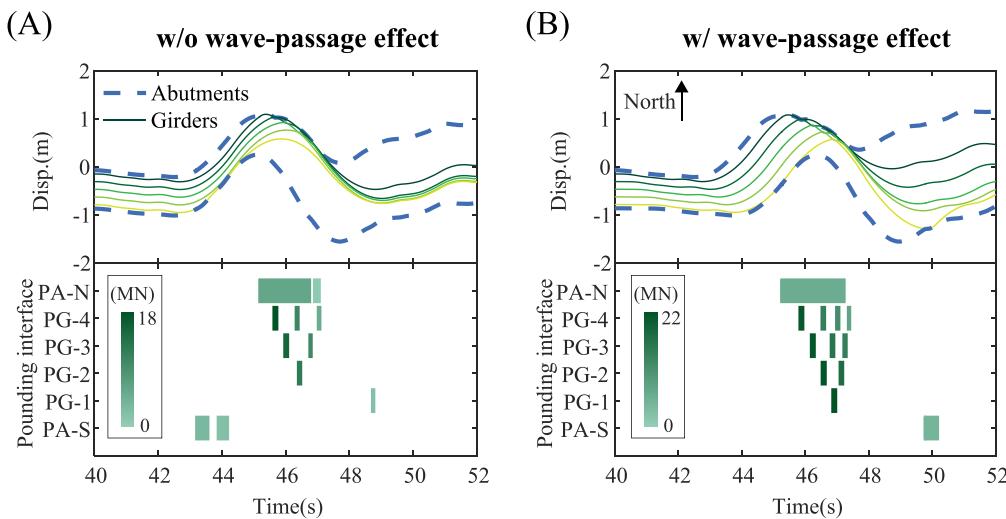
FIGURE 10 | Effect of wave passage on the chain pounding: displacement histories of girders/abutments in absolute coordinate system and pounding Gantt plot for Yematan Bridge under pulse-like ground motion (Wave 5 with P G A = 0 . 3 1 \mathrm {g}, P G V = 1 2 4 \mathrm {c m / s}, T _ {p} = 5 . 5 \mathrm {s}, V _ {p} = 1 2 0 \mathrm {c m / s} )
To further interpret the underlying mechanism governing the bearing displacement distributions, taking T _ {p} ~ = ~ 5 . 5 s as a representative example, Figure 12 shows shifted displacement time-history plots of girders/abutments, where each row adopts a different reference frame. Specifically, the relative displacements of girders/abutments are with respect to the top nodes of southernmost substructures supporting the girders in each frame, that is, seen from Figure 5A, the top of Bent 20 (row 1), Bent 15 (row 2), Bent 10 (row 3), Bent 5 (row 4), and the seat node of south abutment (row 5). One advantage of using these different reference frames is that, for example, the relative displacement of Girder 5 with respect to the top node of Bent 20 is equivalent to the displacement of the bearing between Girder 5 and Bent 20. In other words, the displacement responses of the girder and the bearing supported at this bent share the same line in one plot.
From the first row of Figure 12, where the top node of Bent 20 is taken as the reference point, chain pounding plays a decisive role in bearing displacement at Bent 20. The northward displacement of Girder 5 (i.e., the bearing displacement at Bent 20) is suppressed by front poundings with the north abutment, while enhanced by rear poundings with southern girders. The enhancement effects from the south are considerably stronger than the suppression effects from the north. Furthermore, the wave-passage effect results in out-of-phase motions of girders and abutments, further leading to more pronounced chain pounding. This is evidenced by the larger velocity differences (i.e., steeper slope differences of displacement curves) between adjacent girders and abutments prior to impact. Therefore, the displacement of bearing at Bent 20 will gradually become larger than that in the case where the wave-passage effect is not considered, especially for longer T _ {p} where chain pounding becomes more intense as shown in Figure 11.
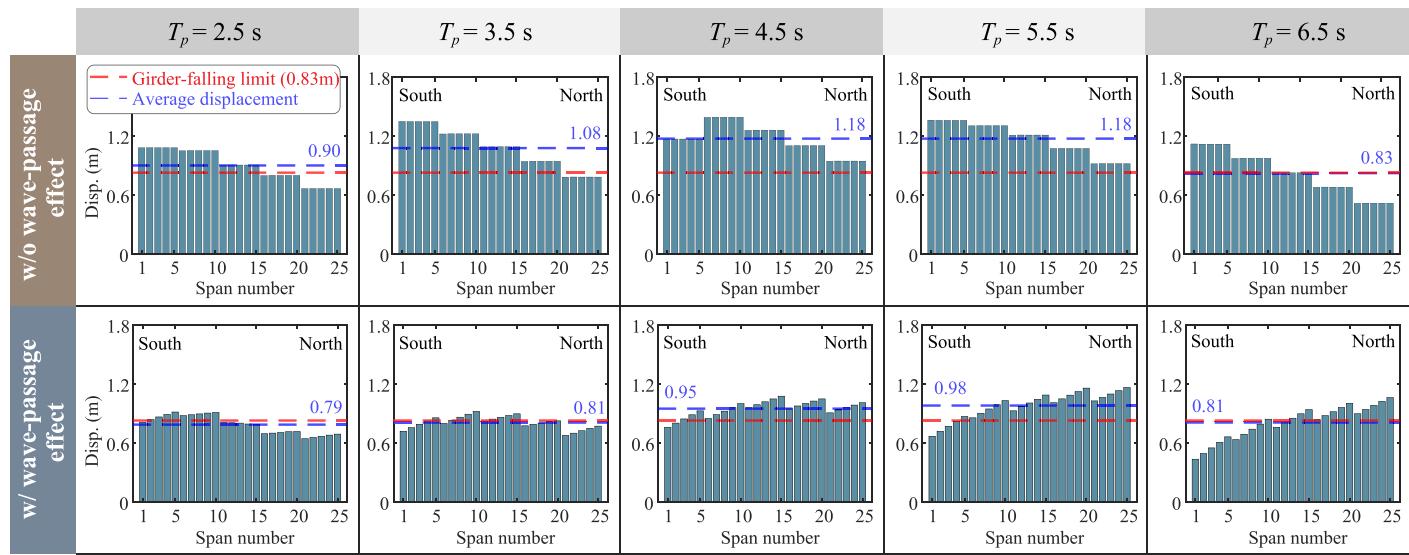
FIGURE 11 | Effect of wave passage on the distribution of bearing displacement across all spans for Yematan Bridge under pulse-like ground motions (Wave 5 with V _ {p} = 1 2 0 \mathrm {c m / s} and varied T _ {p _ { \cdot} })
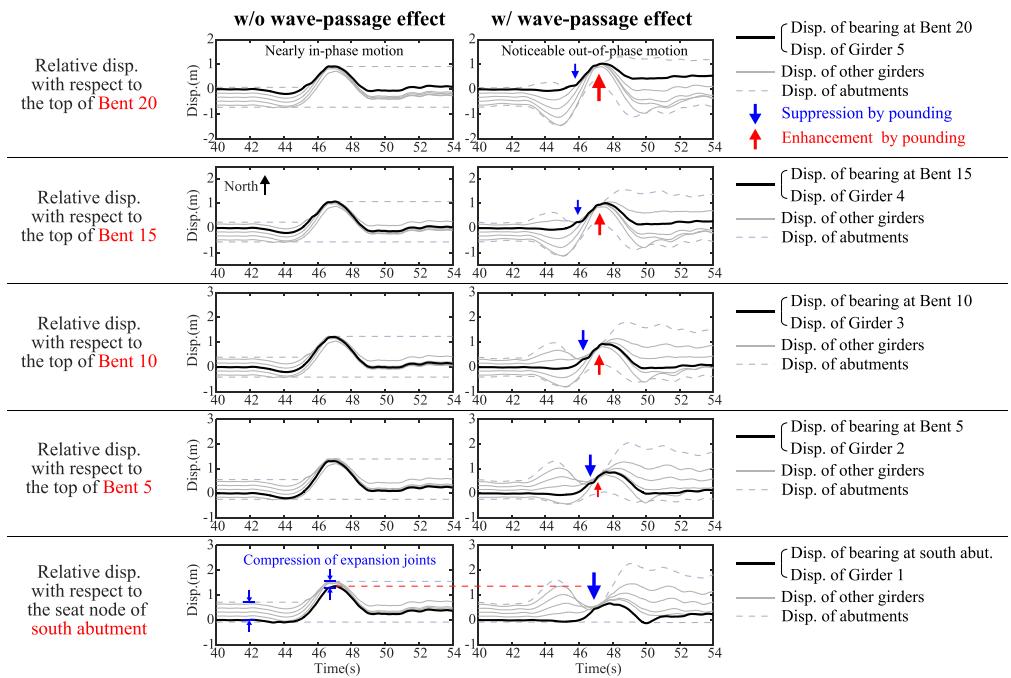
FIGURE 12 | Effect of wave passage on the bearing displacement distributions at Bent 20, 15, 10, 5, and south abutment (from north to south), illustrated by shifted displacement histories of girders and abutments for Yematan Bridge under synthetic pulse-like ground motion (Wave 5, T _ {p} = 5 . 5 \mathrm {s}, V _ {p} = 1 2 0 \mathrm {c m / s} ))
From the last row of Figure 12, where the seat node of the south abutment is used as the reference point, the wave-passage effect has a pronounced influence on the relative displacement of Girder 1 (i.e., the bearing displacement at the south abutment). Without the wave-passage effect, the in-phase motions of girders and abutments compress the expansion joints across frames, allowing Girder 1 greater space to move northward without pounding against Girder 2, thereby resulting in a bearing displacement pattern where southern bearing displacements exceed those on the northern side. When the wave-passage effect is considered, however, the out-of-phase motions trigger significant chain pounding, in which the northern girders and the north abutment suppress the movement of Girder 1, leading to smaller southern bearing displacements compared to those in the north.
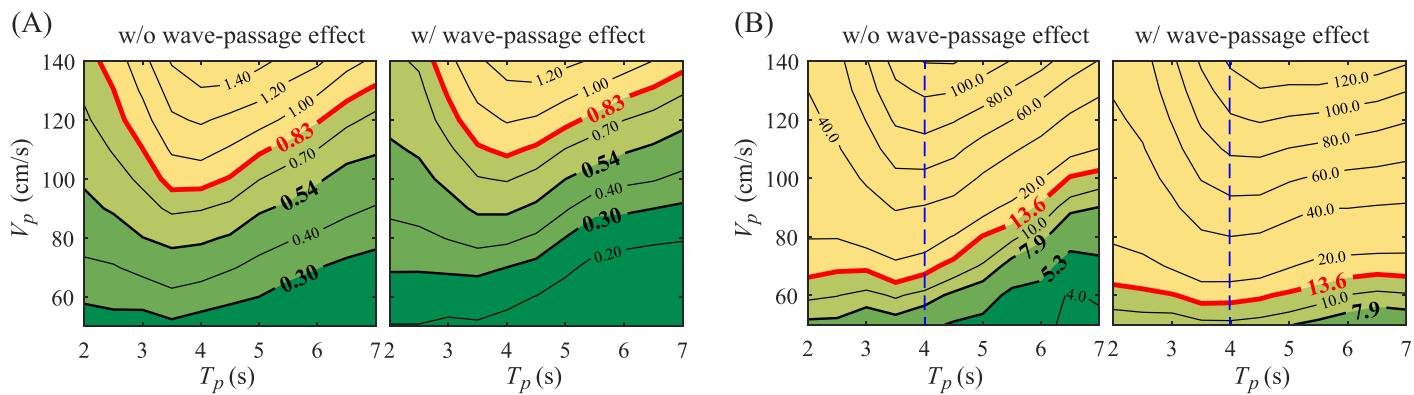
FIGURE 13 | Effect of wave passage on the (A) average bearing displacement and (B) north abutment displacement for Yematan Bridge under pulse-like ground motions with various pulse parameters (i.e., T _ {p} and V _ {p ,}); the north abutment displacements significantly increase due to more intensive chain pounding for T _ {p} > 4 . 0 ~ \mathrm {s}
Overall, when the wave-passage effect is not considered, the in-phase motions of girders and abutments, together with the compression of expansion joints, account for the displacement pattern where the southern bearing displacements exceed those of the northern side, as well as for the larger average bearing displacements. In contrast, when the wave-passage effect is considered, the changes in bearing displacements-namely, a completely opposite distribution of bearing displacements from south to north-are primarily driven by chain pounding. It is Worth noting, however, that the wave-passage effect has little influence on the maximum absolute displacements of girders (recall Figure 10).
Contour displacement responses of bearing and north abutment in Yematan Bridge, with and without wave-passage effects, are shown in Figure 13. As discussed earlier, the average displacement responses of bearings are generally smaller when the wave-passage effect is considered. However, the north abutment displacements significantly increase, especially for longer pulse periods (i.e., T _ {p} > 4 . 0 s, see the right side of blue dashed line in Figure 13B), because the enhanced displacement of the northern girder caused by chain pounding becomes more pronounced as T _ {p} increases.
6.3 Effect of Number of Spans
To investigate the effect of the number of spans, single-frame bridges with various span configurations ( 1 \times 3 , 1 \times 5 , 1 \times 1 0 , 1 \times 1 5 and 1 \times 2 5 ), as well as a counterpart bridge without abutments, are analyzed under synthetic pulse-like ground motions. Note that the results for bridge without abutments are independent of the number of spans, since all girders undergo identical inphase motions (without considering the wave-passage effect). Also, chain pounding is excluded since all cases consist of a single frame.
Figure 14 shows contour charts of average bearing displacements and north abutment displacements. Compared to the bridge without abutments, the differences in the results of Bridges 1 \times 3 , 1 \times 5 , 1 \times 1 0 , 1 \times 1 8 , and 1 \times 2 5 are primarily attributed to the influence of their abutments. The effect of the abutments is reflected in the shift of the girder-falling and abutment-failure regions towards shorter T _ {p} and larger V _ {p} , which becomes more remarkable as the number of spans decreases. This shift occurs because the abutments increase the overall stiffness of the bridge. To further elucidate this, an energy-weighted mean period \left(T _ { m} \right) [78] is employed to characterize the dominant frequency (period) components in the girder vibrations, as given by
where S _ {F} ~ (f _ { i} ) denotes the Fourier power spectrum of girder acceleration at frequencies f _ {i} within a sufficiently wide range of 0 . 0 1 {-} 2 5 \operatorname {H z}
Figure 15 presents contour plots of dominant periods of girder vibration under earthquakes. The dominant period at a T _ {p} {-} V _ {p} pair in this figure is the average dominant period derived from the girder acceleration responses against seven motions for that T _ {p} {-} V _ {p} pair. Across the subplots of Figure 15 (from right to the left), the bridge dominant periods are notably reduced, especially for short bridges, due to the effective constraint of abutments. Under the pulse-like motions, structural displacement responses reach peaks when T _ {p} approaches the bridge vibration period, as reported in previous studies [79]. Therefore, a reduction in the bridge vibration period leads to a decrease in the unfavorable pulse period, that is, the period at which maximum displacement responses occur. From a general comparison between Figures 14A and 15, variations of bridge dominant periods with respect to V _ {p} , T _ {p} , and-most importantly-the number of spans, align with the trend in the bearing displacement responses.
Figure 16 presents the displacement and velocity time histories of girders under pulse-like ground motions with different pulse periods ( (T _ { p} ) . The instances when girder pounds against the south and north abutments are marked by blue and red dashed lines, respectively. The results can be interpreted from two perspectives. First, regarding the effects of abutments, the presence of abutments stiffens the bridge system and reduces its dominant vibration period. Consequently, compared with the case without abutments, girder displacements increase under short-period motions (Figure 16A) but decrease under long-period motions (Figure 16B). Second, in terms of the bridge length, a smaller number of spans means a more evident effect of abutment constraint, and more pronounced reduction of bridge vibration period. Thus, under short-period motions, displacements of shorter bridges are slightly larger than those of longer bridges (Figure 16A), whereas under long-period motions, they become significantly smaller (Figure 16B).
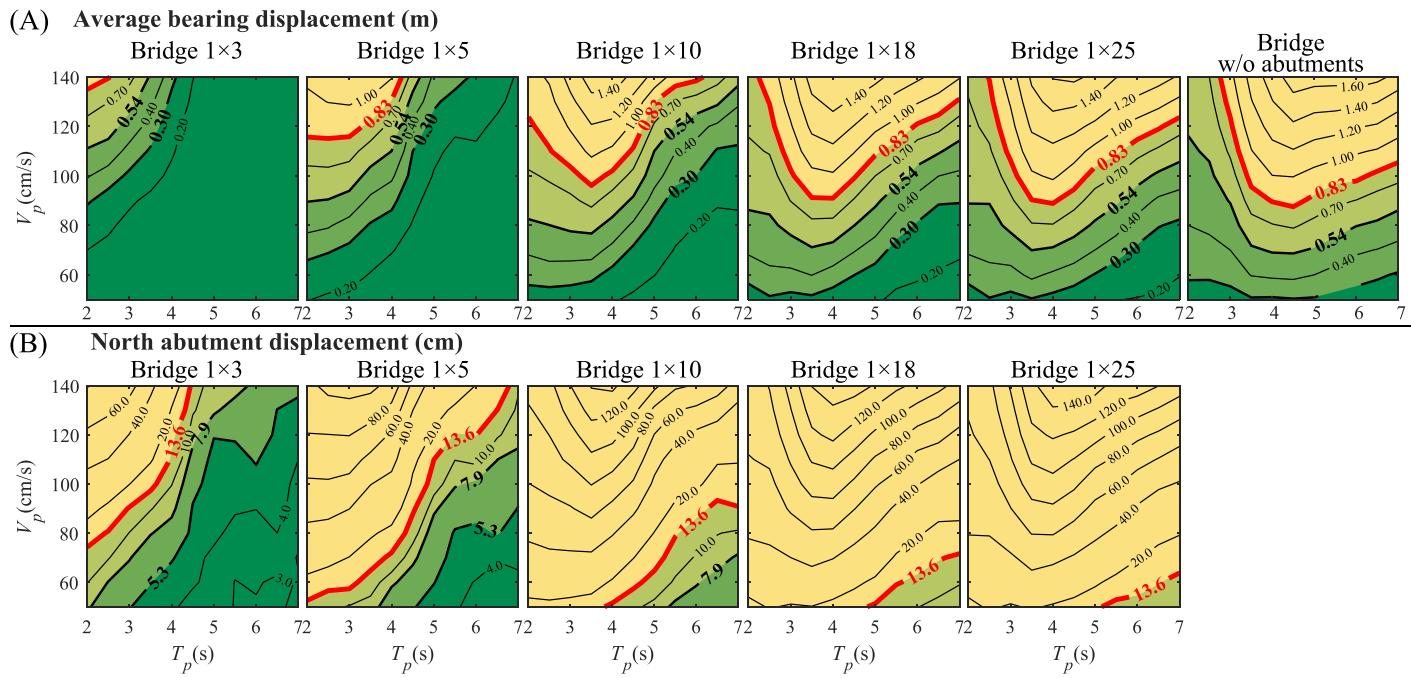
FIGURE 14 | Effect of number of spans on the (A) average bearing displacement and (B) north abutment displacement for one-frame bridges under pulse-like ground motions with various pulse parameters (i.e., T _ {p} and V _ {p .})
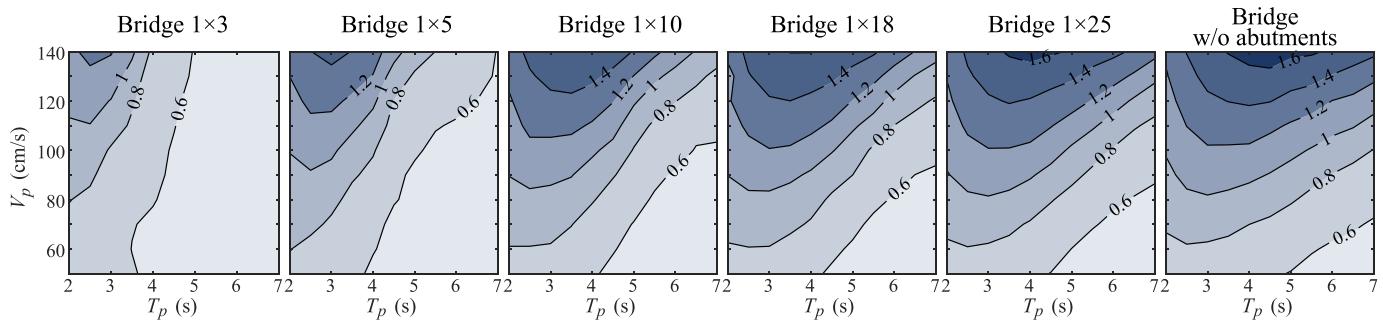
FIGURE 15 | Effect of number of spans on the girder dominant vibration period (unit: s) for one-frame bridges under pulse-like ground motions with various pulse parameters (i.e., T _ {p} and V _ {p .})
6.4 Effect of Number of Frames
To investigate the impact of frame numbers, bridges with various frame \times span configurations, 1 \times 5 , 2 \times 5 , 3 \times 5 , 4 \times 5 , and 5 \times 5 are analyzed under pulse-like ground motions. Figure 17 presents contour charts of average bearing displacements and north abutment displacements. A shift of the girder-falling region and abutment-failure region is also observed, similar to Figure 14, because the total number of spans increases with the increased number of frames. In addition, multi-frame bridges ( M \times N spans in Figure 17) exhibit bearing responses comparable to those of single-frame bridges with the same total number of spans [i.e., 1 \times (M \times N) spans in Figure 14]. However, their abutment displacements are noticeably smaller, especially for longer bridges, such as Bridge 5 \times 5 compared with Bridge 1 \times 25. The reason for this is explained below.
Figure 18 indicatively illustrates the effect of chain pounding on the abutment response under Wave 5 with T _ {p} = 5 . 5 \mathrm {~ s ~} and V _ {p} = 1 2 0 ~ \mathrm {c m / s} . The north abutment displacement equals the adjacent girder displacement minus the expansion joint gap, so the displacement of the northernmost girder is used to interpret the abutment displacement. For Bridge 5 \times 5 , the velocity of the northernmost girder drops when pounding against the north abutment, but soon recovers due to the subsequent rear poundings from southern girders. This exemplifies the energy transfer from south to north during chain pounding, along the pounding paths shown in Figure 18. The transferred energy is mainly dissipated through plastic deformation of the north abutment. Besides, the first velocity increase of Girder 5 caused by the rear pounding from Girder 4 is most evident, while later increases from Girders 3 and 2 gradually diminish, which results from energy dissipation along the chain path and reduced pounding intensity. In addition, more distant girders may not participate in chain pounding, such as Girder 1 in this case. Nevertheless, the energy transferred from Girder 3-5 is sufficient to cause of north abutment failure.
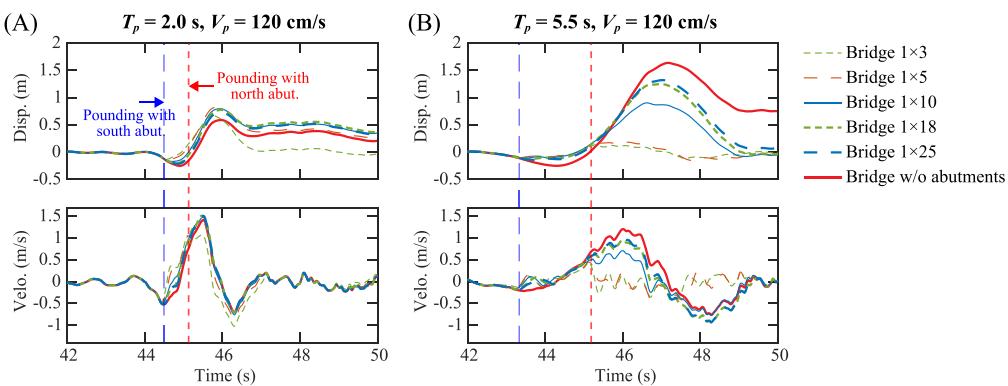
FIGURE 16 | Displacement and velocity histories of girder for one-frame bridges with different number of spans under pulse-like ground motions: (A) T _ {p} = 2 . 0 and V _ {p} = 1 2 0 \mathrm {c m / s}; (B) T _ {p} = 5 . 5 and V _ {p} = 1 2 0 \mathrm {c m / s}
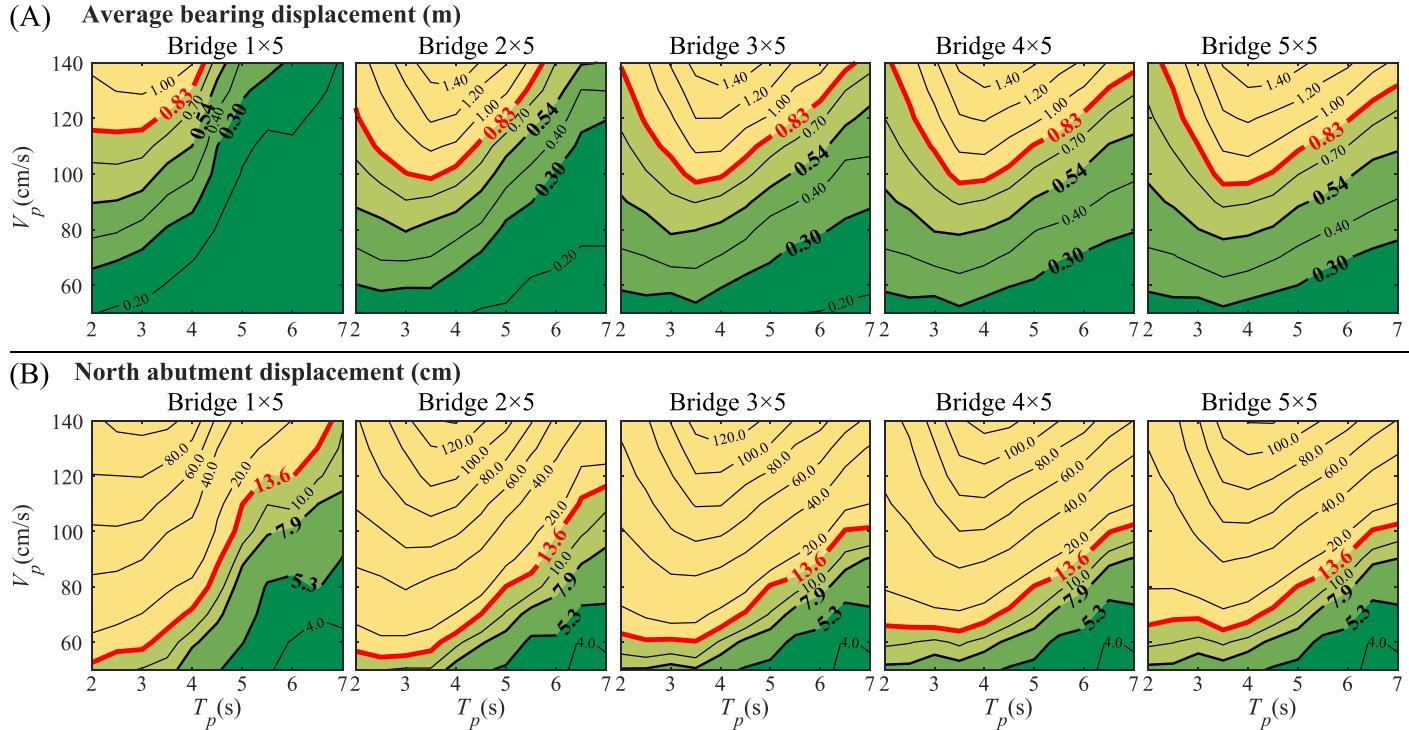
FIGURE 17 | Effect of number of frames on the (A) average bearing displacement and (B) north abutment displacement for multi-frame bridges under pulse-like ground motions with various pulse parameters (i.e., T _ {p} and V _ {p})
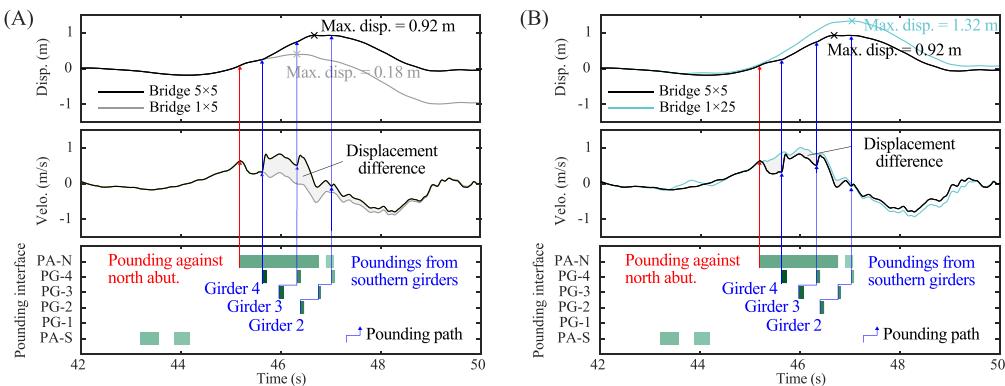
FIGURE 18 | Displacement and velocity histories of the northernmost girder (adjacent to north abutment, i.e., Girder 5 for Bridge 5 \times 5)of (A) Bridge 5 \times 5 and Bridge 1 \times 5, and (B) Bridge 5 \times 5 and Bridge 1 \times 2 5 under pulse-like ground motion with T _ {p} = 5 . 5 and V _ {p} = 1 2 0 \mathrm {c m / s}, along with the pounding Gantt plot for Bridge 5 \times 5
In Figure 18A, the velocity increments induced by the rear poundings from the southern girders lead to a larger displacement of the northernmost girder in Bridge 5 \times 5 compared to the Bridge 1 \times 5. However, in Figure 18B, more pronounced velocity reduction of the girder when pounding against the north abutment results in a smaller girder displacement in Bridge 5 \times 5 even subjected to the rear poundings from southern girders compared to Bridge 1 \times 2 5 . This finding demonstrates that when a multi-frame bridge ( M \times N spans) experiences significant chain pounding, its abutment displacement response falls between that of a 1 \times N -span single-frame bridge and a 1 \times (M \times N) -span single-frame bridge.
7 Conclusions
This study investigates the seismic damage mechanisms of two near-fault, multi-frame highway bridges: Heihe Middle Bridge ( 1 \times 3 spans) and Yematan Bridge ( ( 5 \times 5 spans) via field damage observations and parametric analyses. The key findings are summarized below:
-
The directivity pulse of near-fault seismic motion is the primary cause of the significant seismic damage differences between Heihe Middle Bridge and Yematan Bridge. The possible pulse period in the bridge site region is T _ {p} > 4 . 0 ~ \mathrm {s} and the pulse velocity amplitude is V _ {p} > 1 1 0 \mathrm {c m / s}
-
Heihe Middle Bridge exhibited only slight seismic damage during the Maduo earthquake due to its smaller span number (and thus lower total mass). The abutments effectively constrained the girders, significantly increasing the overall stiffness of the bridge structure. The structural period, being far from the pulse period, resulted in minimal response.
-
Despite having only five spans in each frame, Yematan Bridge experienced significant chain pounding, transferring kinetic energy from adjacent several girders to the north abutment. This caused severe damage to the north abutment, leading to uncontrolled girder displacement and widespread girder collapse. Compared to uniform excitation, the wave-passage effect significantly increased the pounding force, frequency, duration, the number of participating girders due to out-of-phase motions of girders and abutments. This led to the formation of a bearing displacement distribution pattern where the northern bearing displacements are larger than those of the southern bearings, consistent with the field-observed girder-falling pattern where widespread girder falling concentrated on the northern side.
-
The primary reason for the differing responses between long and short bridges is the varying influence of abutments.
Abutments increase the overall stiffness of the bridge, thereby shortening its dominant vibration period. This constraint effect becomes stronger in bridges with fewer spans. As a result, under short-period pulse-like motions, the displacement responses of girder in shorter bridges are generally larger than that in longer bridges, whereas under long-period motions, the opposite holds true, with longer bridges exhibiting larger responses.
-
Chain pounding exhibits a characteristic inverted-triangle time-space distribution of pounding events in the proposed pounding Gantt plot. The formation of chain pounding is influenced by ground motion pulse parameters and phase differences in girder movement caused by limited apparent wave velocity. In chain pounding, energy is transferred between girders in the same direction through successive pounding events, increasing the displacement demand of the girders and abutments in the direction of energy transfer. This effect is particularly pronounced when considering the wave-passage effect.
-
When a multi-frame bridge ( M \times N spans) experiences significant chain pounding under pulse-like ground motion, its abutment displacement response in the direction of chain pounding falls between that of a 1 \times N -span single-frame bridge and a 1 \times (M \times N) -span single-frame bridge.
For bridges in near-fault regions, seismic design of multi-frame/multi-span highway girder bridges should carefully consider the relationships between bridge length and the pulse period of ground motions. On the other hand, it is advisable to place displacement-restraining piers at some intervals, which, in effect, divide the bridge into shorter segments, mitigating chain pounding and improving control of girder displacements; the associated design approach merits further study. In addition, damage from the Maduo earthquake highlights the essential role of abutments in preventing longitudinal collapse, indicating the need for further work on how chain-pounding effects should be incorporated into abutment design, particularly for near-fault pulse-like motions.
Acknowledgments
This study is partially supported by National Natural Science Foundation of China (Grant Nos. 52478200 and 52378183).
Conflicts of Interest
The authors declare no conflicts of interest.
Data Availability Statement
The data that support findings of this study are available from the corresponding author upon reasonable request.
References
-
M. Bruneau, I. G. Buckle, S. Chang, et al., The Chi-Chi, Taiwan Earthquake of September 21, 1999: Reconnaissance Report (Multidisciplinary Center for Earthquake Engineering Research, 2000).
-
J. Li, T. Peng, and Y. Xu, “Damage Investigation of Girder Bridges Under the Wenchuan Earthquake and Corresponding Seismic Design
Recommendations, ” Earthquake Engineering and Engineering Vibration 7, no. 4 (2008): 337-344. 3. A. S. Elnashai, B. Gencturk, O. S. Kwon, et al. The Maule (Chile) Earthquake of February 27, 2010: Consequence Assessment and Case Studies; 2010. 4. N. Chouw and H. Hao, “Pounding Damage to Buildings and Bridges in the 22 February 2011 Christchurch Earthquake, ” International Journal of Protective Structures 3, no.2(2012): 123-139. 5. Y. Demirtas, E. Sülev, O. Tunaboyu, A. Bozer, and O. Avsar, “Seismic Performance of RC Buildings and Highway Bridges During the Kahramanmaras Earthquakes.”Paper presented at: 18th World Conference on Earthquake Engineering; 2024. 6. M. Shirato and Y. Odawara, “Field Observations on the Damage to Road Bridges After the 2023 Turkey Earthquake, ”Earthquake Spectra 40, no.2 (2024): 997-1018. 7. M. Miari, K. K. Choong, and R. Jankowski, “Seismic Pounding Between Bridge Segments: A State-of-the-Art Review, ”Archives of Computational Methods in Engineering 28, no.2(2021): 495-504. 8. C. P. Pantelides and X. Ma, “Linear and Nonlinear Pounding of Structural Systems, "Computers and Structures 66, no.1(1998): 79-92. 9. A. Ruangrassamee and K. Kawashima, “Relative Displacement Response Spectra With Pounding Effect, ”Earthquake Engineering & Structural Dynamics 30, no.10 (2001): 1511-1538. 10. K. T. Chau and X. X. Wei, “Pounding of Structures Modelled as Non-Linear Impacts of Two Oscillators, ”Earthquake Engineering & Structural Dynamics 30, no.5 (2001): 633-651. 11. R. DesRoches and S. Muthukumar, “Effect of Pounding and Restrainers on Seismic Response of Multiple-Frame Bridges,"Journal of Structural Engineering 128, no.7(2002): 860-869. 12. E. Dimitrakopoulos, N. Makris, andA. JKappos, “DimensionalAnalysis of the Earthquake-Induced Pounding Between Adjacent Structures, "Earthquake Engineering & Structural Dynamics 38, no.7(2009): 867-886. 13. E. Dimitrakopoulos, N. Makris, and A. J. Kappos, “Dimensional Analysis of the Earthquake Response of a Pounding Oscillator, ”Journal of Engineering Mechanics 136, no.3 (2010): 299-310. 14. E. G. Dimitrakopoulos, N. Makris, and A. J. Kappos, “Dimensional Analysis of the Earthquake-Induced Pounding Between Inelastic Structures, ”Bulletin of Earthquake Engineering 9, no.2(201): 561-579. 15. A. Guo, Z. Li, H. Li, and J. Ou, “Experimental and Analytical Study on Pounding Reduction of Base-Isolated Highway Bridges Using MR Dampers, ”Earthquake Engineering & Structural Dynamics 38, no.11 (2009): 1307-1333. 16. P. K. Malhotra, M. J. Huang, and A. F. Shakal, “Seismic Interaction at Separation Joints of an Instrumented Concrete Bridge, ”Earthquake Engineering & Structural Dynamics 24, no.8 (1995): 1055-1067. 17. A. Guo, L. Cui, S. Li, and H. Li, “A Phenomenological Contact-Element Model Considering Slight Non-Uniform Contact for Pounding Analysis of Highway Bridges Under Seismic Excitations, ”Earthquake Engineering & Structural Dynamics 44, no.11 (2015): 1677-1695. 18. A. Guo, Z. Li, and H. Li, “Point-to-Surface Pounding of Highway Bridges With Deck Rotation Subjected to Bi-Directional Earthquake Excitations, ”Journal of Earthquake Engineering 15, no.2(2oll): 274-302. 19. B. Shrestha, L. X. He, H. Hao, K. Bi, and W. X. Ren, “Experimental Study on Relative Displacement Responses of Bridge Frames Subjected to Spatially Varying Ground Motion and Its Mitigation Using Superelastic SMA Restrainers, ”Soil Dynamics and Earthquake Engineering 109 (2018): 76-88. 20. O. Lumb, H. Roberts, C. Kun, and N. Chouw, “The Influence of Pounding on the Seismic Performance of Skewed Bridges". in Proceedings of the 2016 Conference of the New Zealand Society for Earthquake Engineering. 2016: 8 pp. 21. C. Kun, L. Jiang, and N. Chouw, “Influence of Pounding and Skew Angle on Seismic Response of Bridges, ”Engineering Structures 148 (2017): 890-906. 22. I. M. Thomaidis, A. J. Kappos, andA. Camara, “Dynamics and Seismic Performance of Rocking Bridges Accounting for the Abutment-Backfill Contribution, ”Earthquake Engineering & Structural Dynamics 49, no.12 (2020): 1161-1179. 23. H. H. Darwash and K. R. Mackie, “Effect of Seat-Type Abutment Load Path and Failure Mode on Seismic Response of Straight Ordinary Bridges, ”Engineering Structures 242 (2021): 112560. 24. M. S. Saiidi, A. Vosooghi, and R. B. Nelson, “Shake-Table Studies of a Four-SpanReinforcedConcreteBridge"JournalofStructuralEngineering 139, no.8 (2013): 1352-1361. 25. S. A. Moayyedi, H. Rezaei, A. Kalantari, and R. Jankowski, “Effects of Deck-Abutment Pounding on the Seismic Fragility Curves of Box-Girder Highway Bridges, ” Journal of Earthquake Engineering 28, no.8 (2024): 2188-2217. 26. N. Li, W. Xu, Y. Chen, and W. Yan, “Experimental Research on Adjacent Pounding Effect of Midspan Curved Bridge With Longitudinal Slope, ”Engineering Structures 196 (2019): 109320. 27. H. Rezaei, S. A. Moayyedi, and R. Jankowski, “Probabilistic Seismic Assessment of RC Box-Girder Highway Bridges With Unequal-Height Piers Subjected to Earthquake-Induced Pounding, ”Bulletin of Earthquake Engineering 18, no.4 (2020): 1547-1578. 28. C. Kun, Z. Yang, and N. Chouw, “Seismic Performance of Skewed Bridges With Simultaneous Effects of Pounding and Supporting Soil," Engineering Structures 174 (2018): 26-38. 29. B. Sha, T. Tao, C. Xing, H. Wang, and A. Li, “Pounding Analysis of Isolated Girder Bridge Under Nonpulse and Pulse-Like Earthquakes, ” Journal ofPerformance ofConstructed Facilities 34, no.4(2020): 04020062. 30. Z. Yang, Y. Lyu, and N. Chouw, “Dynamics of a Rocking Bridge With Two-Sided Poundings: A Shake Table Investigation, ”Earthquake Engineering & Structural Dynamics 53, no.13 (2024): 4114-4132. 31. M. Shayanfar, B. M. Ayyub, A. A. Abbasloo, and H. Pahlavan, “The Effect of In-Span Hinges and Span Numbers on the Seismic Vulnerability of Curved Box-Girder Highway Bridges Considering Material and Geometric Uncertainties, ”ASCE-ASME Journal of Risk and Uncertainty in Engineering Systems, Part A: Civil Engineering 7, no.4(2021): 04021045. 32. B. Li, K. Bi, N. Chouw, J. W. Butterworth, and H. Hao, “Experimental Investigation of Spatially Varying Effect of Ground Motions on Bridge Pounding, ”Earthquake Engineering & Structural Dynamics 41, no.14 (2012): 1959-1976. 33. W. Guo, J. Li, Z. Guan, and X. Chen, “Pounding Performance Between a Seismic-Isolated Long-Span Girder Bridge and Its Approaches, ”Engineering Structures 262 (2022): 114397. 34. B. Li, K. Bi, N. Chouw, J. W. Butterworth, and H. Hao, “Effect of Abutment Excitation on Bridge Pounding, ” Engineering Structures 54 (2013): 57-68. 35. G. Zanardo, H. Hao, and C. Modena, “Seismic Response of Multi-Span Simply Supported Bridges to a Spatially Varying Earthquake Ground Motion, ”Earthquake Engineering & Structural Dynamics 31, no.6(2002): 1325-1345. 36. Z. Guan, Y. Huang, H. Zhang, et al., “Damage Characteristics and Analysis of Bridge Engineering in M7.4 Qinghai Maduo Earthquake, ” World Earthquake Engineering 37, no.03 (2021): 38-45.(in Chinese). 37. J. Yuan, Y. Wang, B. Zhan, X. Yuan, X. Wu, and J. Ma, “Comprehensive Investigation and Analysis of Liquefaction Damage Caused by the Ms7.4 Maduo Earthquake in 2021 on the Tibetan Plateau, China, ”Soil Dynamics and Earthquake Engineering 155 (2022): 107191. 38. L. Zu, Y. Huang, W. Li, H. Zhang, and L. Cai, “Seismic Damage Analysis of Yematan Bridge UnderNear-Fault Earthquakes, ”Structures 41(2022): 586-601.
-
C. Zhou, A. Ye, J. Li, and X. Wang, “Unveiling Longitudinal Failure Mechanisms and Macro Constitutive Modeling of Seat-Type Bridge Abutments: Lessons From the 2021 M7.4 Maduo Earthquake, ”Earthquake Engineering & Structural Dynamics 55, no.1(2026): 61-79.
-
W. Wang, L. Fang, J. Wu, et al., “Aftershock Sequence Relocation of the 2021MS7.4 Maduo Earthquake, Qinghai, China, ”Science China Earth Sciences 64, no.8 (2021): 1371-1380.
-
J. Wang, Z. Guan, S. Bao, and L. Cheng, “Reconnaissance Report on Damage of Bridges in 2021 Maduo, China, Earthquake". Paper presented at: IABSE Congress: Bridges and Structures: Connection, Integration and Harmonisation, 2022: 1808-1814.
-
Code for Seismic Design of Buildings (GB 500ll-2010)(China Architecture & Building Press, 2010), (in Chinese).
-
B. W. Maurer, R. A. Green, and O. D. S. Taylor, “Moving towards an Improved Index for Assessing Liquefaction Hazard: Lessons From Historical Data, Soils Found 55, no.4 (2015): 778-787.
-
H. Zhang, Y. Huang, Y. Wang, Z. Guan, B. Zhan, and L. Cai, “Oblique Photography Modeling Displacement Estimation of Yematan Bridges, ” Earthquake Engineering and Engineering Dynamics 42, no.2 (2022): 89-103.in Chinese.
-
F. McKenna, “OpenSees: A Framework for Earthquake Engineering Simulation, ”Computing in Science & Engineering 13, no.4 (2oll): 58-66. 46. J. B. Mander, M. J. N. Priestley, andR. Park, “Theoretical Stress-Strain Model for Confined Concrete, ” Journal of Structural Engineering 14, no. 8(1988): 1804-1826.
-
J. B. Mander, M. J. N. Priestley, and R. Park, “Observed Stress-Strain Behavior of Confined Concrete, ”Journal of Structural Engineering 114, no. 8 (1988): 1827-1849.
-
N. Arioglu, Z. C. Girgin, and E. Arioglu, “Evaluation of Ratio Between Splitting Tensile Strength and Compressive Strength for Concretes up to 120 MPaand Its Application in Strength Criterion, ”ACI Materials Journal 103, no.1(2006).
-
S. Muthukumar, A Contact Element Approach With Hysteresis Damping for the Analysis and Design of Pounding in Bridges (Georgia Institute of Technology, 2003). PhD Thesis.
-
S. Muthukumar and R. DesRoches, “A Hertz Contact Model With Non-Linear Damping for Pounding Simulation, ”Earthquake Engineering & Structural Dynamics 35, no.7(2006): 811-828.
-
M. Dolce, D. Cardone, and F. Croatto, “Frictional Behavior of Steel-PTFE Interfaces for Seismic Isolation, ” Bulletin of Earthquake Engineering 3, no.1(2005): 75-99.
-
Code for Design of Ground Base and Foundation of Highway Bridges and Culverts (JTG D63-2007) (China Communications Press, 2007), (in Chinese).
-
R. Y. Wu and C. P. Pantelides, “Seismic Evaluation of Repaired Multi-Column Bridge Bent Using Static and Dynamic Analysis, ”Construction & Building Materials 208 (2019): 792-807.
-
M. Dicleli, S. Albhaisi, and M. Y. Mansour, “Static Soil-Structure Interaction Effects in Seismic-Isolated Bridges, ”Practical Periodical on Structural Design and Construction 10, no.1(2005): 22-33.
-
The Chinese seismic intensity scale (GB/T 17742-2020). (Standards Press of China, 2020), (in Chinese).
-
J. D. Bray and A. Rodriguez-Marek, “Characterization of Forward-Directivity Ground Motions in the Near-Fault Region, ”Soil Dynamics and Earthquake Engineering 24, no.11(2004): 815-828.
-
Q. Fu and C. Menun, “Seismic-Environment-Based Simulation of Near-Fault Ground Motions". Paper presented at: 13th World Conference on Earthquake Engineering.2004.
-
J. Pan, H. Li, M.-L. Chevalier, et al., “Co-Seismic Rupture of the 2021, Mw7.4 Maduo Earthquake (Northern Tibet): Short-Cutting of the Kunlun Fault Big Bend, ”Earth and Planetary Science Letters 594 (2022): 117703. 59. J. Ren, X. Xu, G. Zhang, et al., “Coseismic Surface Ruptures, Slip Distribution, and 3D Seismogenic Fault for the 2021 Mw 7.3 Maduo Earthquake, Central Tibetan Plateau, and Its Tectonic Implications, ” Tectonophysics 827 (2022): 229275.
-
T. G. Cork, J. H. Kim, G. P. Mavroeidis, J. K. Kim, B. Haldorsson, and A. S. Papageorgiou, “Effects of Tectonic Regime and Soil Conditions on the Pulse Period of Near-Fault Ground Motions, ”Soil Dynamics and Earthquake Engineering 80 (2016): 102-118.
-
B. Halld6rsson, G. P. Mavroeidis, and A. S. Papageorgiou, “Near-Fault and Far-Field Strong Ground-Motion Simulation for Earthquake Engineering Applications Using the Specific Barrier Model, ”Journal of Structural Engineering 137, no.3(2011): 433-444.
-
USGS. M7.3-Southern Qinghai, China, https://earthquake.usgs.gov/earthquakes/eventpage/us7000e54r/executive.
-
L. Cai, Y. Huang, H. Zhang, and Z. Guan, “Earthquake Damage and Enlightenment From Gongyu Expressway in 2021 Qinghai Maduo M7.4 Earthquake, ”World Earthquake Engineering 37, no.3 (2021): 46-56.in Chinese.
-
Z. Li, J. Sun, M. Gao, X. Chen, Y. Zhao, and Q. Wu, “Preliminary Judgment of Ground Motion Characteristics of Yematan Bridge in Qinghai Maduo, ”Reviews of Geophysics and Planetary Physics 53, no.1 (2022): 101-106.in Chinese.
-
Y. Liu, X. Zhao, Z. Wen, et al., "Broadband Ground Motion Simulation Using a Hybrid Approach of the May 21, 2021 M7.4 Earthquake in Maduo, Qinghai, China,"Earthquake Science 36 no.(3), (2023): 175-199.
-
P. Mimoglou, I. N. Psycharis, and I. M. Taflampas, “Explicit Determination of the Pulse Inherent in Pulse-Like Ground Motions, ”Earthquake Engineering & Structural Dynamics 43, no.15 (2014): 2261-2281.
-
S. Yang, G. P. Mavroeidis, and A. Ucak, “Analysis of Bridge Structures Crossing Strike-Slip Fault Rupture Zones: A Simple Method for Generating Across-Fault Seismic Ground Motions, ”Earthquake Engineering & Structural Dynamics 49, no.13 (2020): 1281-1307.
-
N. A. Abrahamson, W. J. Silva, and R. Kamai, “Summary of the ASK14 Ground Motion Relation for Active Crustal Regions, ”Earthquake Spectra 30, no.3 (2014): 1025-1055.
-
D. M. Boore, J. P. Stewart, E. Seyhan, and G. M. Atkinson, “NGA-West2 Equations for Predicting PGA, PGV, and 5 \% Damped PSA for Shallow Crustal Earthquakes, "Earthquake Spectra 30, no.3 (2014): 1057-1085. 70. K. W. Campbell and Y. Bozorgnia, “NGA-West2 Ground Motion Model for the Average Horizontal Components of PGA, PGV, and 5 \% Damped Linear Acceleration Response Spectra, ”Earthquake Spectra 30, no.3 (2014): 1087-1115.
-
B. S. J. Chiou and R. R. Youngs, “Update of the Chiou and Youngs NGA Model for the Average Horizontal Component of Peak Ground Motion and Response Spectra, "Earthquake Spectra 30, no.3 (2014): 1117-1153. 72. C. Zeng, H. Jiang, G. Song, Y. Ren, and Z. Xue, “Nonlinear Seismic Responses of a Long-Span Railway Suspension Bridge Crossing Strike-Slip Fault Rupture Zones, ”Soil Dynamics and Earthquake Engineering 177 (2024): 108388.
-
Y. Zhao, Y. Li, Y. Zhang, and D. Kennedy, “Nonstationary Seismic Response Analysis of Long-Span Structures by Frequency Domain Method Considering Wave Passage Effect, ” Soil Dynamics and Earthquake Engineering 109 (2018): 1-9.
-
R. Jankowski, K. Wilde, and Y. Fujino, “Reduction of Pounding Effects in Elevated Bridges During Earthquakes, ”Earthquake Engineering & Structural Dynamics 29, no.2 (2000): 195-212.
-
I. Anastasopoulos, N. Gerolymos, V. Drosos, R. Kourkoulis, T. Georgarakos, and G. Gazetas, “Nonlinear Response of Deep Immersed Tunnel to Strong Seismic Shaking, ”Journal of Geotechnical and Geoenvironmental Engineering 133, no.9 (2007): 1067-1090.
-
W.-S. Tseng, and J. Penzien, eds, “Soil-FoundationStructure interaction, ”in Bridge Engineering Handbook.2nd ed.(Taylor & Francis, 2014). 77. R. Jankowski and S. Mahmoud, Earthquake-Induced Structural Pounding (Springer International Publishing, 2015).
-
E. M. Rathje, F. Faraj, S. Russell, and J. D. Bray, “Empirical Relationships for Frequency Content Parameters of Earthquake Ground Motions, " Earthquake Spectra 20, no.1(2004): 119-144.
-
N. Makris and C. J. Black, “Dimensional Analysis of Bilinear Oscillators Under Pulse-Type Excitations, ”Journal of Engineering Mechanics 130, no. 9 (2004): 1019-1031.
-
J. Zhang, T. Wang, S. Xiao, and L. Gao, “Chinese Code Methods for Liquefaction Potential Assessment Based on Standard Penetration Test: An Extension, ”Soil Dynamics and Earthquake Engineering 144 (2021): 106697.
-
T. Iwasaki, T. Arakawa, and K. I. Tokida, “Simplified Procedures for Assessing Soil Liquefaction During Earthquakes, ”International Journal ofSoil Dynamics and Earthquake Engineering 3, no.1(1984): 49-58. 82. I. M. Idriss and R. W. Boulanger, “Semi-empirical Procedures for Evaluating Liquefaction Potential During Earthquakes, ”Soil Dynamics and Earthquake Engineering 26, no.2(2006): 115-130.
-
X. Wang, F. Luo, and A. Ye, “A Holistic Framework for Seismic Analysis of Extended Pile-Shaft-Supported Bridges Against Different Extents of Liquefaction and Lateral Spreading, ”Soil Dynamics and Earthquake Engineering 170 (2023): 107914.
-
K. Ke, J. Liu, T. You, L. Xu, and X. Xie, “Ground Motion Intensity Parameter Prediction Considering Topographic Effects, "Journal of Southeast University (Natural Science Edition) 55, no.6 (2025): 1572-1581.in Chinese.
-
J. Zhong, H. Wang, and X. Zhu, “Sensitivity Analysis on Seismic Spatial Variability Parameters Subjected to Differential Support Motions, ” Journal of Southeast University (Natural Science Edition) 54, no.6 (2024): 1377-1385.in Chinese.
-
D. L. Wells and K. J. Coppersmith, “New Empirical Relationships Among Magnitude, Rupture Length, Rupture Width, Rupture Area, and Surface Displacement, ”Bulletin of the Seismological Society of America 84 (1994): 974-1002.
-
H. Xie, Z. Li, D. Yuan, et al., “Characteristics of co-seismic Surface Rupture of the 2021 Maduo Mw 7.4 Earthquake and Its Tectonic Implications for northern Qinghai-Tibet Plateau, ”Remote Sensing 14, no.17 (2022): 4154.
-
X. Zhang, W. Feng, H. Du, S. Samsonov, and L. Yi, “Supershear Rupture During the 2021 M _ {\mathrm { W} } 7.4 Maduo, China, Earthquake, ”Geophysical Research Letters 49, no.6(2022): e2022GL097984.
Appendix A: Configurations of Yematan Bridge and Heihe Middle bridge
Yematan Bridge has two separate lanes for uphill and downhill traffic. Each lane consists of five frames, each being a 5-span girder bridge, totaling 25 spans. The superstructure of each frame consists of simply-supported prestressed concrete hollow slab girders with a continuous concrete deck (see Figure A1A). The bent consists of a cap beam and two reinforced concrete (RC) columns with circular cross-sections supported on individual drilled shafts (see Figure A1C). Dimensions and some material parameters of girders, bent columns, and cap beams are listed in Table A1. Each end of a girder is supported by 14 bearings. Unbonded laminated rubber bearings with stainless steel-PTFE sliding interface are adopted. The expansion joint sizes at abutments and middle bents are {8} \mathrm {c m} and 1 6 \mathrm {{ c m} }, respectively. Heihe Middle Bridge features the same structure as Yematan Bridge, but with a different span configuration (see Figure A1B). Specifically, Heihe Middle Bridge consists of a 3-span girder bridge for each lane. The expansion joint size at abutments is 2 \mathrm {c m}. Both bridges have identical seat-type abutments with two piles as foundation. Detailed abutment configurations are provided in a recent study by the authors [39].
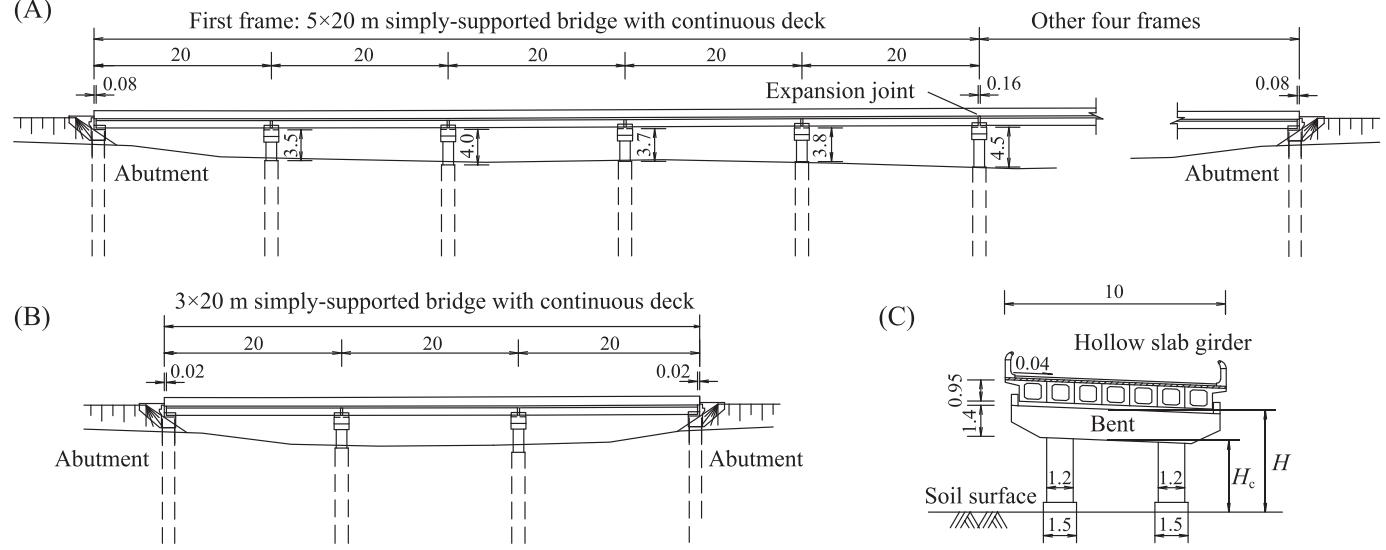
FIGURE A1 | Bridge configuration (unit: m): (A) Yematan Bridge (5 \times 5 spans), (B) Heihe Middle Bridge ( 1 \times 3 spans)and (C) girders and bents.
TABLE A1 | Dimensions and material parameters of bridge components.
| Component | Dimension | Concrete | Reinforcements |
| Girders | L = 20 m; A = 5.6 m² I =0.8 m4,Iy = 40 m4; | Ec= 32.6 GPa | / |
| Bent columns | m = 408 ton per span D = 1.2 m Hc,avg = 2.5 m | fe= 25.5 MPa Ec = 25.2 GPa | Longitudinal: n= 30,ds = 25 mm,fy =335 MPa Stirrups: two hoops at 7cm intervals,d = 12 mm,fy = 335 MPa |
| Cap beams | L = 9.58 m H=1.4 m W=1.7m | Ec = 25.2 GPa | / |
Note: L: length; H height; W width; A : area; D : diameter; I _ {y} and I _ {z} moment of inertia; m mass; H _ {c , a \nu g} : average height of column; E _ {c} : concrete elastic modulus; f _ {c} concrete compressive strength; n , d _ {s} and f _ {y} : number, diameter, and yield strength of reinforcements, respectively.
Appendix B: Quantitative Assessment of Site Liquefaction
B.1 Chinese Code Method
In the current Chinese code [42], te severity of surficial liquefaction can be assessed using the liquefaction index \left(I _ { \mathrm { l E} } \right) of soil within a depth of 2 0 \mathrm {m} :
with
where n is the total number of soil layers, divided based on the locations of SPT test points. The ratio N _ {i} / N _ {c r , i} represents the liquefaction potential of the i -th soil layer. N is the uncorrected SPT blow count, and N _ {c r} is the critical SPT blow count. W _ {i} is the depth weight function value of the i . -th soil layer. The critical SPT blow count N _ {c r} can be determined by:
where a _ {\mathrm { m a x} } represents the horizontal peak ground acceleration (g) , z _ {s} and z _ {w} are the depths of the soil being assessed and the groundwater table \mathrm {( m) } , respectively. \rho _ {c} denotes the clay content (\%) (particle size smaller than 0 . 0 0 5 \mathrm {m m} ) and should be set to 3 when it is less than 3 or when the soil type is sandy. M signifies the earthquake magnitude without specifying the type of magnitude scale, although moment magnitude \left(M _ { \mathrm { w} } \right) is preferred [80]. According to the Chinese code method, the liquefaction level is minor when the liquefaction index I _ {\mathrm { l E} } \leq 6 , severe when I _ {\mathrm { l E} } > 1 8 , and moderate when I _ {\mathrm { { l E} } } falls in between.
B.2 Ishihara-Inspired Liquefaction Potential Index ( L P I _ { \mathrm { I S H } } )
Based on the traditional Liquefaction Potential Index (L P I) proposed by Iwasaki et al.[81]., Maurer et al.[43]. developed a novel Ishihara-inspired Liquefaction Potential Index (L P I _ { \mathrm { I S H} } ) , which incorporates the effects of a non-liquefied surface layer and a power-law depth weighting function. As a result, it shows improvement over L P I in mitigating false-positive predictions. Therefore, the liquefaction index L P I _ {\mathrm { I S H} } proposed by Maurer et al. is utilized to evaluate the severity of liquefaction at bridge sites, and the formula is [43]
with
where F S is the factor of safety against liquefaction, m (F S) is the slope of the Ishihara boundary curve, H _ {1} is the thickness of the surface non-liquefiable layer, z is the depth to the ground surface, and w ^ {\prime} (z) = 2 5 . 5 6 / z is the modified depth weight function in a power-law form [43]. The factor of safety
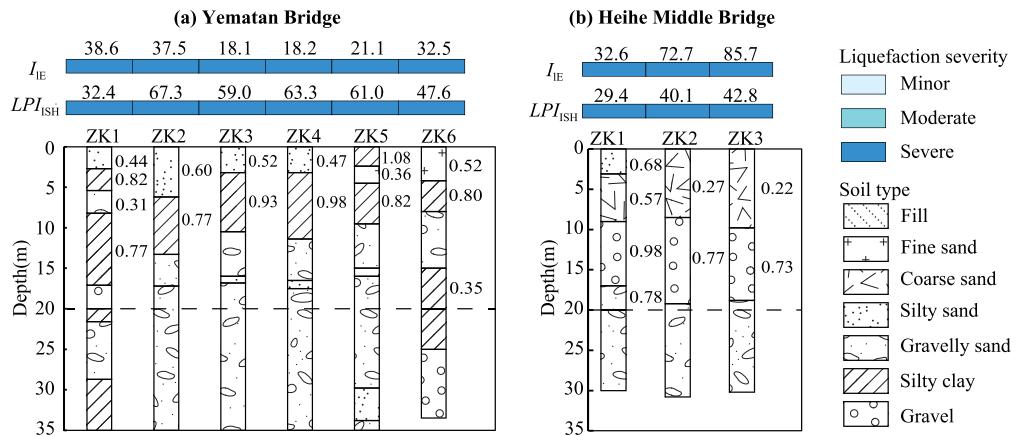
FIGURE B1 | Assessment of liquefaction severity at bridge sites according to Chinese code method and L P I _ {\mathrm { I S H} }-based method.
against liquefaction, F S , can be estimated following the semi-empirical liquefaction evaluation procedure proposed by Idriss and Boulanger [82]:
where C R R _ {7 . 5 , \sigma = 1} and C S R _ {7 . 5 , \sigma = 1} are the cyclic resistance ratio (i.e, capacity) and the cyclic stress ratio (i.e., demand), respectively, for M _ {\mathrm { w} } = 7 . 5 earthquakes and effective vertical stress \sigma {'} _ {v} = 1 atm. The C R R _ {7 . 5 , \sigma = 1} can be estimated in terms of the soil penetration resistance, specifically (N _ { 1} )_ { 6 0 c s} for clean sand, where the fine content (particle size smaller than 0 . 0 7 5 \mathrm {m m} is less than 5 \% . If the fine content of the test soil is greater than 5 \% , an equivalent clean sand (N _ { 1} )_ { 6 0 c s} can be estimated using the method of Idriss and Boulanger [82]. The C S R _ {7 . 5} is related to the maximum horizontal acceleration at the ground surface a _ {\mathrm { m a x} } (g), the stress reduction coefficient r _ {d} , the magnitude scaling factor M S F , the overburden correction factor K _ {\sigma} , total vertical stress \sigma _ {\nu} , and effective vertical stress \sigma _ {\phantom { \prime} v 0 } ^ {\prime} at depth z The parameters r _ {d} , M S F , and K _ {\sigma} can be estimated according to Idriss and Boulanger [82].
In the original L P I _ {\mathrm { I S H} } framework, liquefaction manifestation is anticipated when L P I _ {\mathrm { I S H} } \ge 5 However, the liquefaction severity grade is not specified. In this regard, the liquefaction severity grade proposed by Wang et al.[83].is applied, indicating minor liquefaction when 5 \leq L P I _ {\mathrm { I S H} } < 1 0 , moderate liquefaction when 1 0 \leq L P I _ {\mathrm { I S H} } < 2 0 , and severe liquefaction when L P I _ {\mathrm { I S H} } \geq 2 0
B.3 Liquefaction Severity Assessment Results
A total of 28 data points were collected from Yematan Bridge and 13 from Heihe Middle Bridge. Based on these data, the results of the liquefaction severity assessment at the bridge sites are presented in Figure B1, utilizing a maximum horizontal acceleration at the ground surface of a _ {\mathrm { m a x} } = 0 . 4 \ : \mathrm {g}. The average N / N _ {\mathrm { c r} } ratio for each soil stratum is also listed next to the stratum histogram. The results indicate that the liquefaction index for most boreholes is significantly greater than the severe liquefaction threshold, indicating that both bridge sites fall into the severe liquefaction category. Notably, these results are consistent with the assessment by Yuan et al. [37]., although the I _ {\mathrm { l E} } values in this paper are higher due to the inclusion of more data points, based on the assumption that liquefaction did not occur if data are missing for a particular stratum.
Appendix C: Fault Characteristics and Bridge Location
Ground-motion prediction commonly incorporates multiple key factors, including source mechanisms, wave-propagation effects, and site response [84, 85]. In this context, the fault characteristics and the spatial relationship between fault plane and the bridge site are summarized to aid in the generation of near-fault directivity pulse-like ground motions. The moment magnitude, epicenter location, focal depth, fault type, strike, and dip are listed in Table C1. According to Wells and Coppersmith [86], the primary approach for estimating subsurface rupture dimensions is the spatial pattern of early aftershocks. The aftershock sequence relocated by Wang et al. [40]. within eight days after the mainshock indicates the total rupture length as approximately 1 7 0 \mathrm {k m}, with focal depths mainly between 4 and 1 6 ~ \mathrm {k m}. Thus, we estimate the rupture plane to be 1 7 0 \mathrm {k m} long and 1 2 \mathrm {k m} wide, with a Z _ {T O R} of 4 \mathrm {k m} (\boldsymbol {Z} _ {T O R} is the depth to top of rupture). Field surveys [59, 87] showed the surface rupture zone was about 1 0 0 ~ \mathrm {m} wide with three to four parallel cracks, passing just north of Yematan Bridge, approximately 0 . 5 \mathrm {k m} from the center of the bridge. Figure C1A shows a cross-section perpendicular to the fault plane, depicting the relative locations of the bridge and fault. The surface rupture zone is assumed to align with the fault plane extension, yielding a Joyner-Boore distance (R _ { J B} ) of 1 . 3 \mathrm {k m} and a rupture distance (R _ { r u p} ) of 4 . 2 \mathrm {k m}. The shear wave velocity at the bridge site (V _ { s 3 0} ) is 2 6 0 ~ \mathrm {m / s}, as estimated from geotechnical reports detailed in a recent study by the authors [39]. Additionally, Figure C1B shows a 3D view depicting the relative spatial relationship between the bridge and the focus. Angle between the bridge longitudinal axis and the direction from the epicenter to the bridge site (\alpha) is 5 0 . 5 ^ {\circ}. Seismic wave incidence angle (\beta) at the bridge site is 7 6 . 2 ^ {\circ}, assuming homogeneous soil conditions and neglecting seismic wave refraction between soil layers.
TABLE C1 | Information of rupture fault and studied bridge sites in the Maduo earthquake.
| Items | Values | Reference | Items | Values | Reference |
| Moment magnitude Ms | 7.4 | [40,59] | Distance from bridge site to surface rupture: | ~0.5km | [59, 85] |
| Epicenter | 34.652N,98.398E | [40] | R RJB | R + ZToR tan(Dip)=1.3 km | |
| Focal depth | 7.6km | Rrup | √RB + ZOR= 4.2km | ||
| Fault type | Strike slip | [40,58, 59] | Vs30 at bridge site | 260 km/s | [39] |
| Strike | 286° | [88] | α | 50.5° | |
| Dip | 79° | arctan(31/7.6) = 76.2° | |||
| Rupture length | 170km | [40] | 一 | ||
| Rupture Width | 12km | ||||
| ZTOR | 4km |
aHomogeneous soil is assumed, excluding the refraction of seismic waves between soil layers.
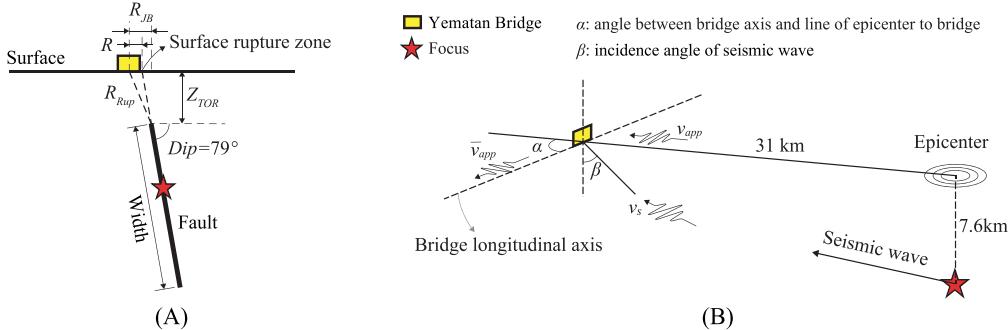
FIGURE C1 | Spatial relationship between Yematan Bridge and the rupture fault: (A) cross-section view perpendicular to the fault plane and (B) three-dimensional view.